
Bear Hunter: Beating SPY While Being in the Market 17% of the Time
The 13.24% Volatility Overlay - Opening 20 Beta Spots Thursday

Over the last 31 years, the S&P 500 had 5 calendar years with significant negative returns. During those five years, a standard SPY position averaged a loss of 17.62%.
Here is what Bear Hunter returned during those exact same years:
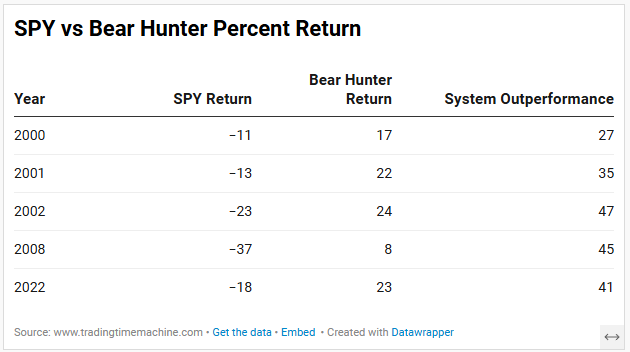
Average across those five crash years: Bear Hunter +16.77%.
Sit with that number before reading anything else.
What Bear Hunter is
As a quant system developer, I specialize in building systems that address gaps in client portfolios and trading trajectories. I created Bear Hunter as a powerful volatility overlay with a single focus: systematically capturing mean-reversion rebounds during high-volatility regimes. This capability is typically absent from most investor and trader returns.
It is 100% long-only. No shorting, no options, no margin. Because it trades only the standard SPY ETF or equivalent, it is fully IRA compatible. It is not a replacement for your core portfolio. It is designed to sit alongside one.
The logic is straightforward. The system monitors two things: the VIX volatility regime and a set of quantified price exhaustion signals. When markets are calm, it sits in cash. When volatility crosses a defined threshold and price conditions align, it enters SPY for a mean-reversion trade. When that rebound matures or is negated, it exits on fixed rules. No forecasting, no macro judgment, no discretion; only predefined criteria.
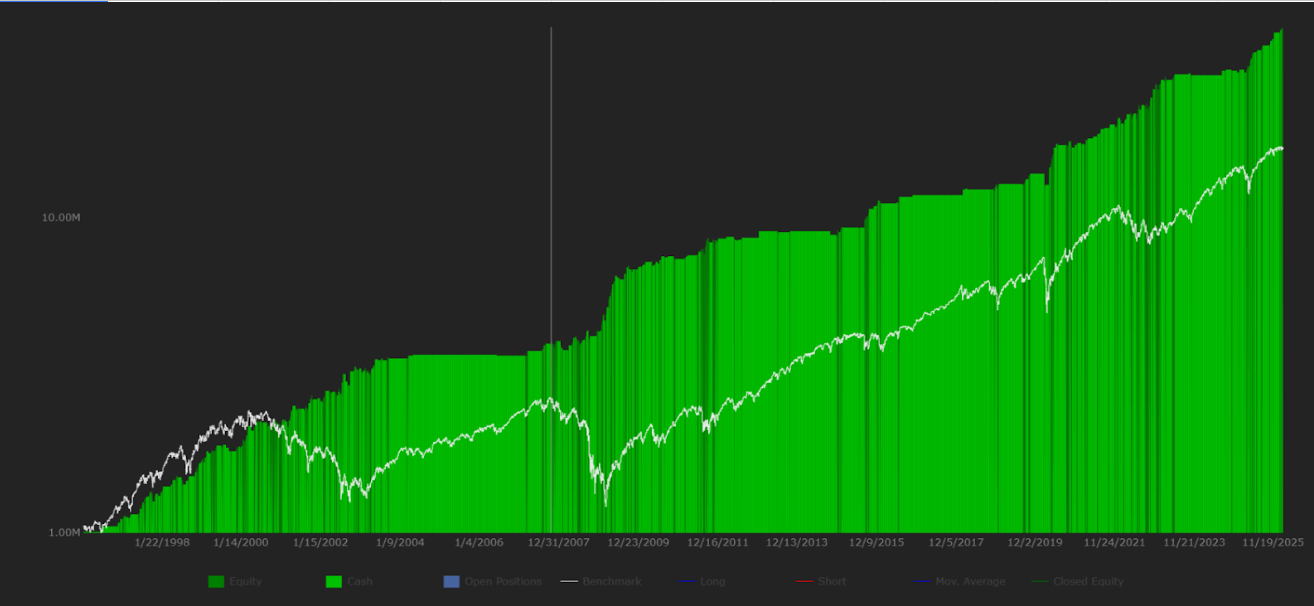
Over the full 31-year backtest (1996 to 2026, 425 total trades):
Annual return: 13.24% vs. SPY’s 10.99%
Market exposure: 17.08% of total trading days
Profit Factor: 2.49
Sharpe Ratio: 1.28 (increasing your Sharpe when paired with existing strategies)
That exposure figure is worth pausing on.
This system outperformed the SPY benchmark while being in the market less than one day in five. The other 83% of the time it was sitting in cash, completely out of the way of whatever else you are doing.
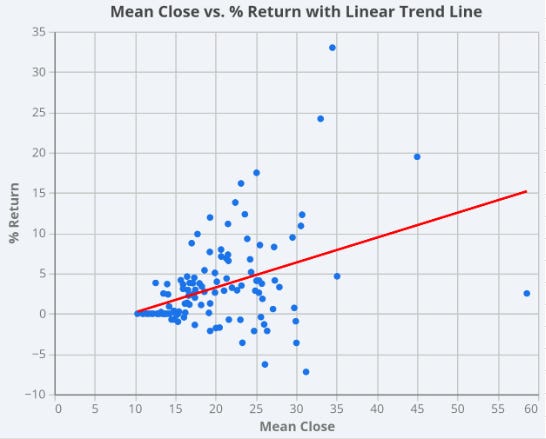
The crash year performance is the standout metric, but this pattern extends across broader market conditions. Quarters with elevated average VIX levels have consistently generated stronger returns for the system. Rather than being a liability, volatility is the core environment Bear Hunter was engineered to live in.
Here we can see all of the quarterly mean VIX closes with the associated Bear Hunter quarterly return.
The full trade history, equity curve, drawdown data, and raw metrics are available here: Bear Hunter Data. I would encourage you to study the losing trades and the worst drawdown periods as closely as the wins. That is where you will understand whether this fits your approach. Dig in to each of the tabs at the bottom of the spreadsheet.
What you get with a Lifetime License
The Complete System Rules. Every formula, indicator setting, and entry/exit criterion. You own the underlying logic permanently -- you are not renting a signal.
The Bear Hunter Command Dashboard. To make daily execution as simple as possible, I built an automated Google Sheet that does the heavy lifting for you. Click "Update," it pulls current market data, runs the algorithm, and prints a clear daily signal. No coding required.
The Master Operating Guide. A detailed manual covering the full historical stats, indicator explanations, and real-world execution scenarios so you know exactly what to do when a signal fires.
Direct Access. My contact info is in your welcome package. Please email as I want to make sure your setup is running correctly from day one.
The Beta
Before the public launch, I am opening 20 spots.
The goal is practical. I want to confirm the documentation is clear, the dashboard is updating cleanly, and the daily routine is manageable for real people with real portfolios. System discipline matters, and I want the tools to make that easy.
The public lifetime license will be $547. Beta participants receive the same license with identical features and full functionality for $347, in exchange for structured feedback during implementation.
I am keeping the group at 20 so I can work directly with each person.
Thursday I will send the private checkout link. First come, first served. When the 20 spots are gone, the link closes.
Before then, spend time with the trade history. Look at how the system behaved in 2000, 2008, and 2022. Think about how it would have interacted with your existing allocation during those periods.
Then make a simple decision in advance: if the structure makes sense to you, act when the beta opens. If it does not, pass.
No pressure. No urgency tactics. Just transparent data, defined rules, and a straightforward opportunity to implement them.
If you have any specific questions as you review the trade history and data, simply reach out to me. I am happy to answer them before the doors open.
Talk soon,
Dave Johnson - Quantitative System Designer at
As you’ve been constructing this and eyeing this – – obviously depends on everyone’s own portfolio but do you have any thoughts on portfolio management and what you would ideally personally target for (range) of percentage of overall portfolio ?