
Building a Better System From a Bunch of Average Ones
This is the case for uncorrelated strategy portfolios and a WealthLab implementation that is worth studying.

One of the most underappreciated ideas in systematic trading is that you do not need great systems as much as you need uncorrelated ones.
I want to walk you through a forum thread that illustrates this beautifully. A WealthLab community member named DrKoch, a developer some of you will recognize from his Finantic indicators extensions, implemented all seven trading systems from Laurens Bensdorp’s book Automated Stock Trading Systems and combined them into a single Meta Strategy. The thread is here, and I would encourage you to read it in full:
Laurens Bensdorp’s Automated Stock Trading Systems - WealthLab Discussion
What makes this worth your time is not just the systems themselves, but what happens when you put them together and what the correlation matrix reveals about why it works.
The Seven Systems
Bensdorp’s seven systems each target a distinct market condition. DrKoch implemented all of them with full production grade architecture including liquidity filters, differentiator conditions, setups, entries, ranking logic, and a complete exit suite.
Here’s the lineup:
Short RSI Thrust - which focuses on short side mean reversion on RSI extremes
Short Mean Reversion High Six Day Surge - involving short entries after parabolic runs
Long Trend Low Volatility - for trend following in quiet conditions
Long Trend High Momentum - for trend following on breakout momentum
Long Mean Reversion Selloff - buying oversold stocks after sharp drops
Long Mean Reversion High ADX Reversal - mean reversion with ADX confirmation
Catastrophe Hedge - which is short biased and activates during market dislocations
These include long and short positions as well as trend and mean reversion across calm and volatile markets. Each system is deliberately built to behave differently from the others, which is the differentiator condition Bensdorp bakes into every strategy.
Individually, none of these is going to make your jaw drop.
The Meta Strategy
WealthLab’s Meta Strategy feature lets you run multiple strategies simultaneously and treat them as a single unified portfolio. DrKoch loaded all seven in with equal weighting.
Start with this chart - all seven individual profit curves overlaid on one graph:
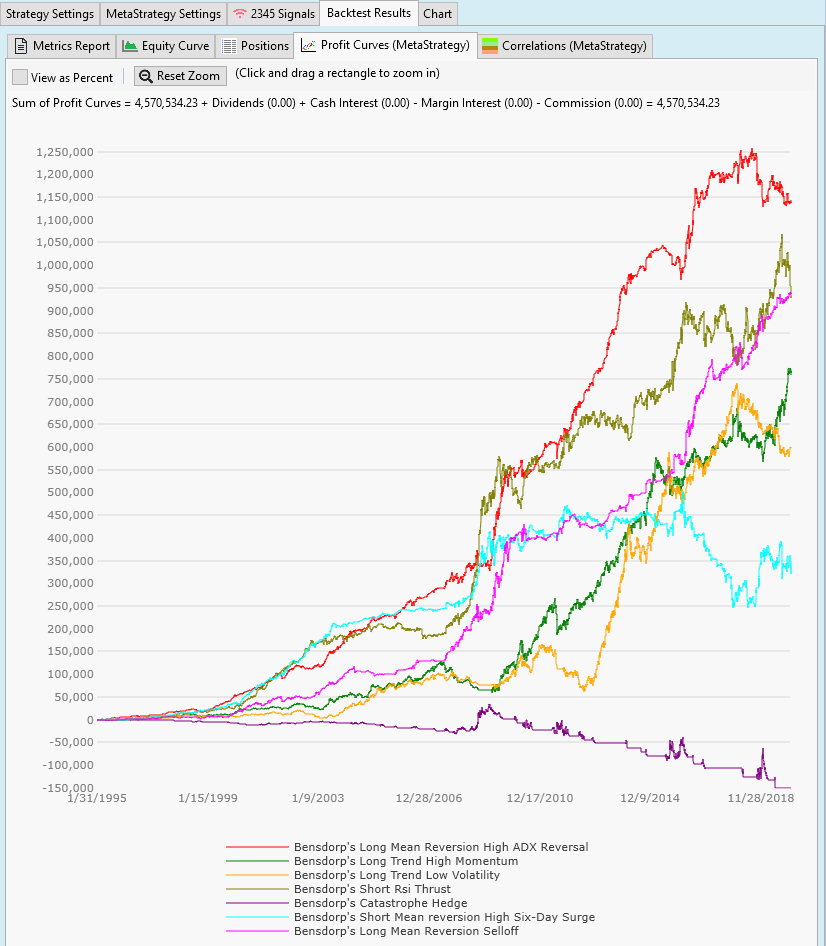
Take a moment with this one. A few things to notice:
The purple line, representing the Catastrophe Hedge, actually goes negative over much of the period and sits below zero at the end. By any conventional measure, you would throw that system out. The pink Mean Reversion Selloff flatlines for years at a stretch while the orange Trend Low Volatility meanders with no conviction through long stretches of the backtest.
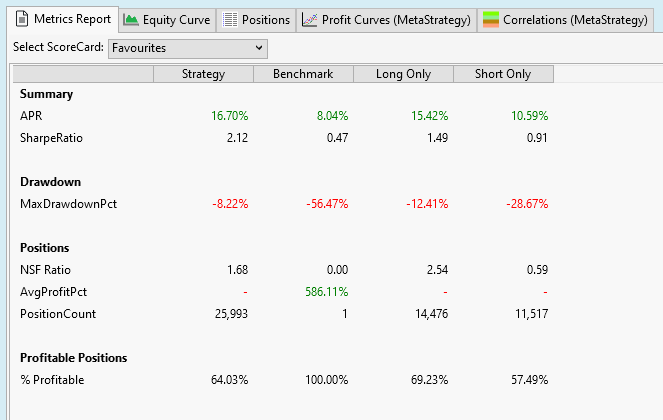
And yet. The combined Meta Strategy produces a 16.70% APR with a max drawdown of just 8.22% and a Sharpe of 2.12. No individual system in this portfolio gets close to that risk-adjusted profile. What produces it is not any single edge. It is the fact that they don't fail at the same time.
When the Catastrophe Hedge is bleeding, which it does during extended bull markets by design, the trend following systems are running hard. When the trend systems stall in a choppy and range bound tape, the mean reversion systems are printing trades. The system that looks like deadweight in isolation is doing a job you cannot see until you view the whole ensemble.
Now look at the combined equity curve against the benchmark:
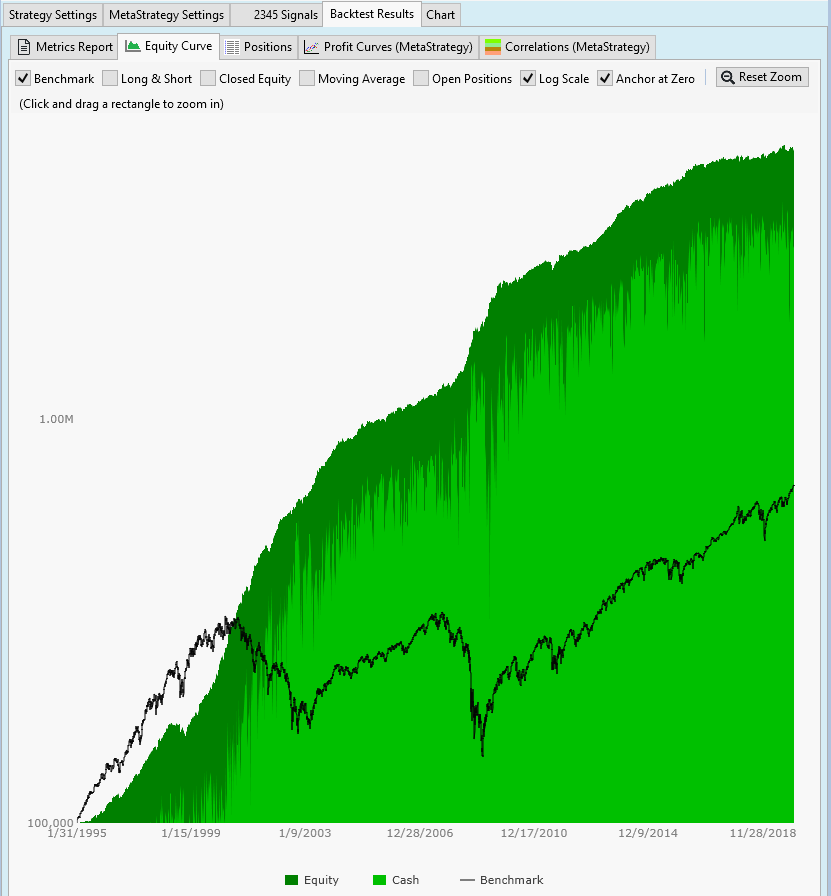
This is on a log scale, which is the right way to look at long run compounding. The black line is the S&P 500. Notice what happens during 2000 to 2002 and again in 2008 to 2009 where the benchmark gets cut nearly in half both times. The green equity curve barely registers those events by comparison. The portfolio is not just compounding faster than the benchmark, it is doing it with dramatically less drawdown through the two worst market environments of the last 30 years.
That's the payoff from running systems that don't all hate the same market conditions.
The Correlation Matrix
DrKoch published the correlation matrix of all seven systems against each other, and this is where the mechanics become clear:
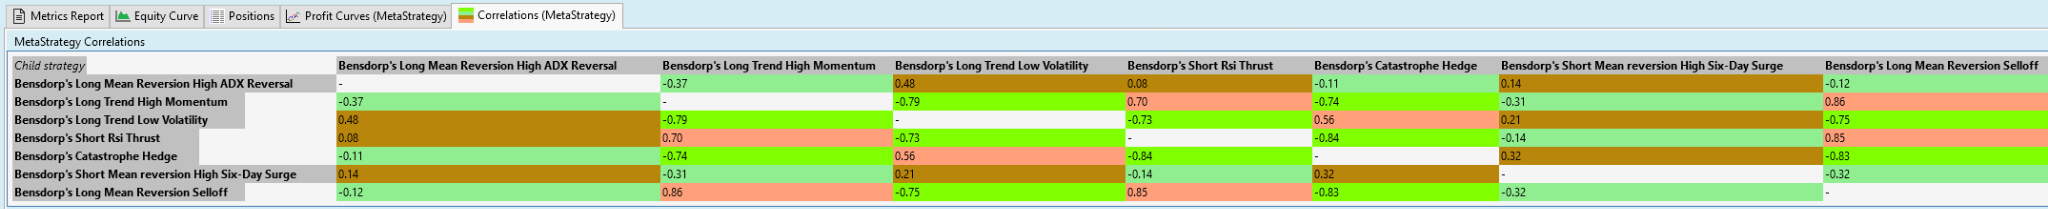
There are low correlations across the board. These systems are not seven versions of the same bet. They are seven genuinely different bets that each have a positive expected value but do not tend to lose at the same time.
This distinction matters more than most traders realize. You can build ten trend-following systems and think you have a diversified portfolio. But if they all get long in the same bull run and all get stopped out in the same crash, your correlation is effectively 1.0 where it hurts most. The diversification is an illusion.
True uncorrelation means the system that struggles in a choppy, low-volatility grind is offset by the one that thrives in it. The one that bleeds during a slow melt-up is covered by the one that’s short parabolic names. That’s what this correlation matrix is showing you.
Out-of-Sample Validation
DrKoch tested the Meta Strategy on data from 2022 onward, which was a period deliberately kept out of development. It held up. That is not a trivial result. 2022 was a genuinely difficult environment that broke a lot of strategies that looked great in backtests. The diversification effect here was not curve fitted to a particular historical window.
The Core Idea
The reason this thread is worth studying isn’t the specific parameters. It’s the demonstration of a principle that holds up across markets, timeframes, and system types:
The portfolio is the strategy.
Individual systems are the components while uncorrelation is the architecture. The equity curve you are trying to build is not the output of any single system but the output of how they interact with each other.
If you’re backtesting systems in isolation and selecting the ones with the best individual metrics, you may be optimizing the wrong thing. A system with a modest Sharpe ratio that is genuinely uncorrelated with your existing portfolio contributes more than a high-performing system that largely mirrors what you already have.
The question worth asking about any new system you build isn’t just “does this work? It’s “what does it look like when I add this to everything else I'm running?”.
I am constantly on the lookout for new uncorrelated systems.
What does your current system portfolio look like from a correlation standpoint? I’d be curious to hear in the comments.
Have Great Night!
Dave Johnson
I love this post. Would you be able to share on getting started with running automated trading systems like the ones you have here?