
Does ATR Extension Predict a Reversal? 25 Years of Nasdaq 100 Data Says Not What You Think
The short term data validates the caution. The longer term data tells a very different story

A recent piece by Nigel at theStrat Lab caught my attention. He took Jeff Sun's 50 SMA ATR extension heuristic and backed it with real distribution data across nearly 2,700 tickers and 1.9 million candles. The bell curve framework he built around ATR extension levels is genuinely useful. It tells you where price extension lives statistically and when a stock is entering rare territory. What it does not tell you is what happens to forward returns after a stock crosses above those extension levels. That is the question this study addresses.
I tested every Nasdaq 100 constituent over 25 years using non-survivorship bias corrected data. That distinction matters. Most backtests use only current index members and quietly inherit an upward bias from testing only on survivors. Every stock that was ever in the Nasdaq 100 is in this data regardless of what happened to it afterward. Testing was done in Wealth-Lab using WealthData, a clean daily bar data source checked for bad ticks and data oddities. The entry signal is straightforward. The first close above a moving average plus a specific ATR multiplier. The ATR is calculated using the standard 14 period setting throughout. One position per symbol. No market filter. I then measured what happened over holding periods from 5 days out to 150 days.
Three variables shape the results. The moving average period, tested from 10 to 200 days. The ATR multiplier, meaning how far above the moving average the stock needs to be before the signal fires, tested from 1.0x to 8.0x in half point increments. And the holding period after entry, tested from 5 to 150 days in 5 day steps. That is 2,250 parameter combinations across 25 years of data. The goal was not to find the best single combination. It was to understand how each variable affects forward returns and where the signal generates genuine alpha over simply buying any Nasdaq 100 stock at random.
Before looking at what the ATR extension signal produces it is worth establishing a baseline. What does a random entry in a Nasdaq 100 stock held for a fixed period actually return over 25 years? The answer is better than most people expect. The Nasdaq 100 has a strong upward bias over this period. A random 5 day entry produces a profit factor of 1.10 with a 51.8% win rate. At 30 days that rises to 1.34. At 60 days 1.50. At 120 days 1.74. The market itself is doing a lot of work.
That baseline matters because it is the honest benchmark for everything that follows. The ATR extension signal is only interesting if it beats random entry. And the first finding is not what most people would expect. At 5 days the ATR extension signal underperforms random entry across nearly every combination tested. The short term caution Nigel’s article implies is in the data. These stocks consolidate, pause, and sometimes pull back in the immediate days after crossing above a significant extension level. Buying them right at the breakout is not the edge.
But hold those same stocks longer and something changes.
From around 30 to 60 days onward the ATR extension signal starts separating from random entry. The gap widens consistently as the holding period extends. By 120 days the separation is meaningful across most combinations and dramatic at higher ATR multipliers. By 150 days the signal is still improving. The study stops there not because the edge disappears but because the focus here is the short to intermediate term holding period that the original article never explored.
This is not a mean reversion story. The stocks that break above statistically significant ATR extension levels are not snapping back to their moving averages. They are strong stocks expressing momentum that persists over months. The rubber band keeps stretching. The data is consistent on that point across 25 years, across multiple moving average periods, and across a wide range of ATR multipliers.
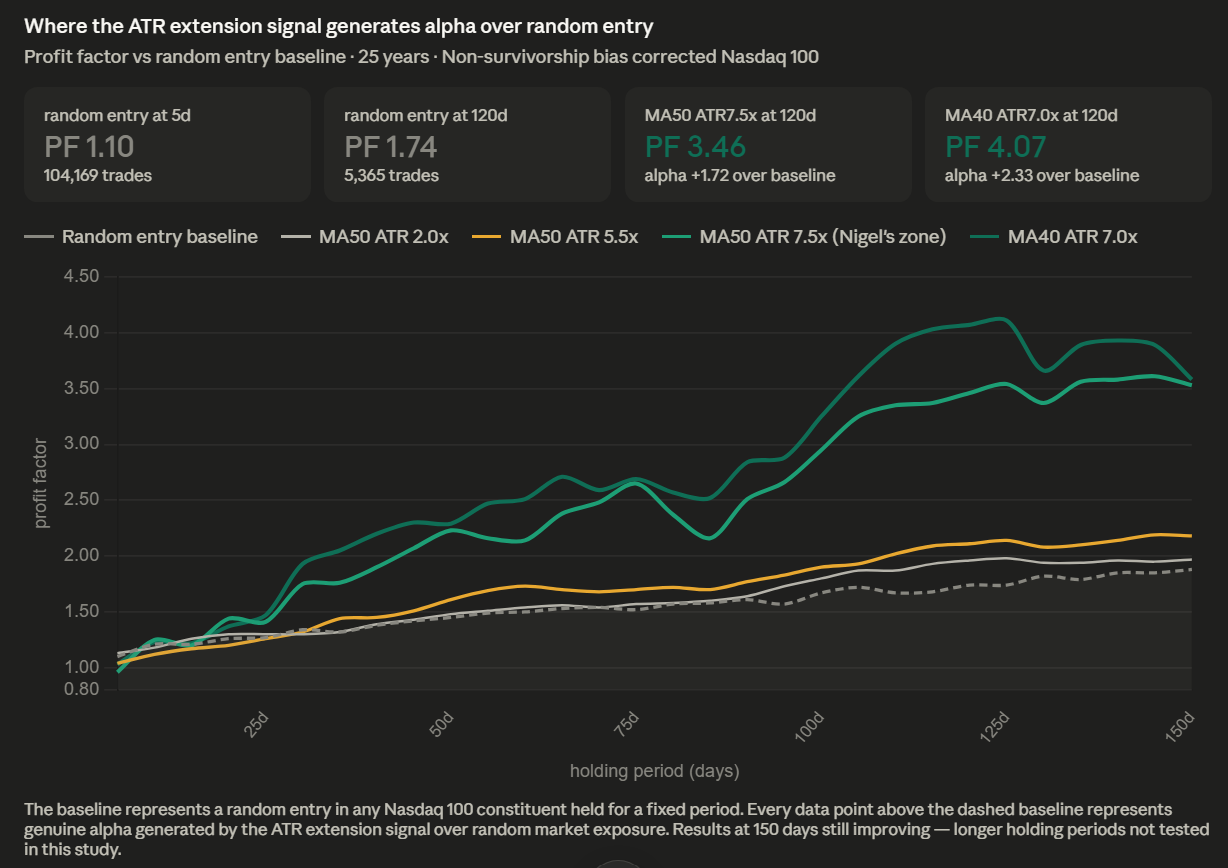
The chart above tells the story clearly. At low ATR extension levels the signal barely separates from random entry. The market’s own upward bias is doing most of the work. As the ATR multiplier increases the separation grows and it grows consistently over time. The stocks that break above statistically extreme extension levels are not average stocks having an average day. They are demonstrating unusual momentum strength. And that strength tends to persist. Not immediately. But over the following weeks and months the data shows these stocks outperforming a random entry in the same universe by a widening margin.
The 50 SMA at 7.5x ATR, the specific zone Nigel's article highlights as statistically rare, reaches a profit factor of 3.46 at 120 days versus 1.74 for random entry. The 40 SMA at 7.0x ATR reaches 4.07 versus the same 1.74 baseline. These are not marginal differences. They represent a genuine and consistent edge for a trend following approach built around momentum continuation.
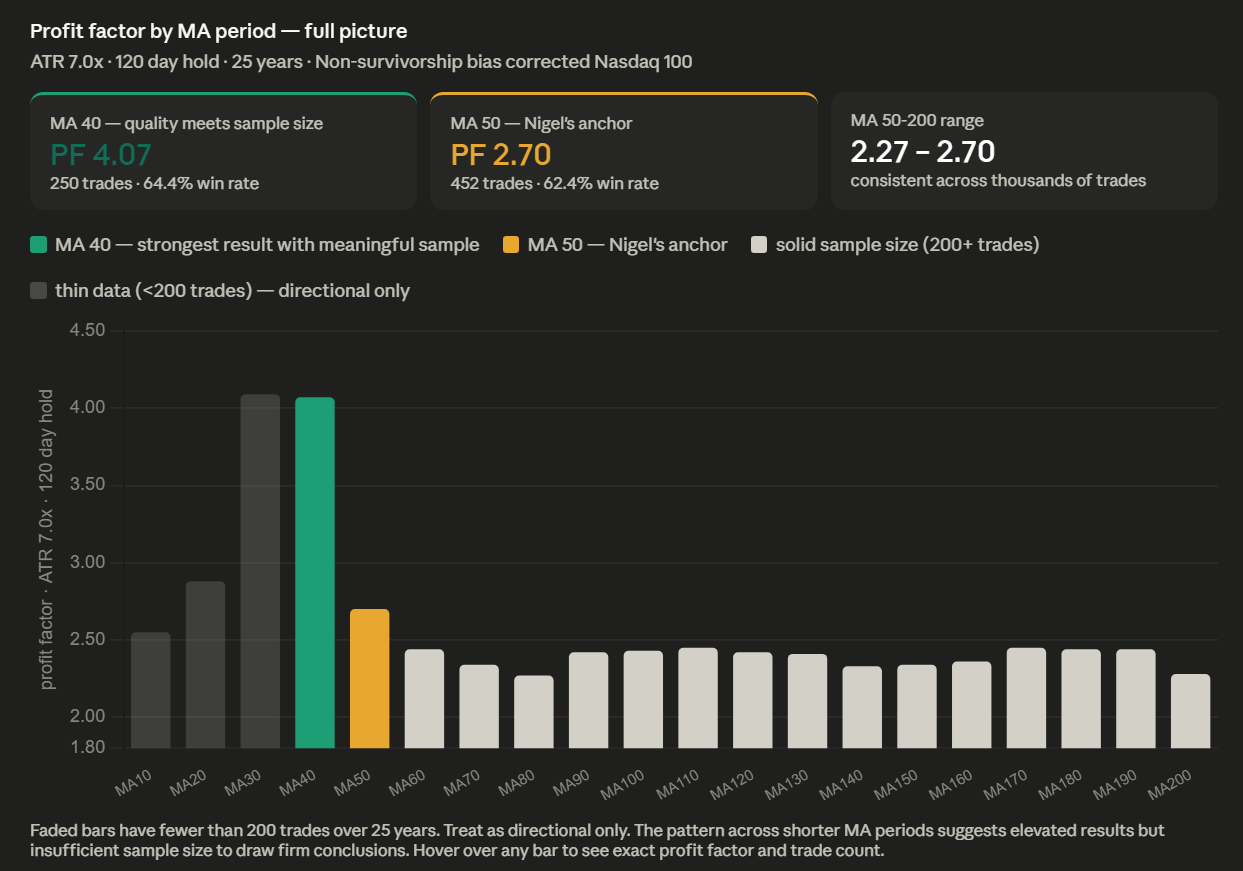
Not all moving averages perform equally. The intermediate term moving averages in the 20 to 50 day range produce the strongest results at longer holding periods. The 40 day moving average stands out specifically at higher ATR multipliers. At 7.0x ATR and a 120 day hold the MA 40 reaches a profit factor of 4.07 with a 64.4% win rate and an average winner of 26.31% versus an average loser of 11.69%. That is a 2.25 to 1 winner to loser ratio with a majority win rate. The 50 SMA that Nigel’s article focuses on delivers a solid 2.70 at the same holding period and ATR level. The MA 40 simply performs better at extreme extension levels with meaningful trade counts.
One important caveat. At very high ATR multipliers the shorter MA periods like 10, 20, and 30 show even higher profit factors but with very thin trade counts. The MA 40 at 250 trades is where elevated quality meets the most meaningful sample size in the shorter MA range. From MA 50 onward the signal settles into a consistent and reliable range across thousands of trades. The signal works broadly. You are not dependent on finding one specific moving average.
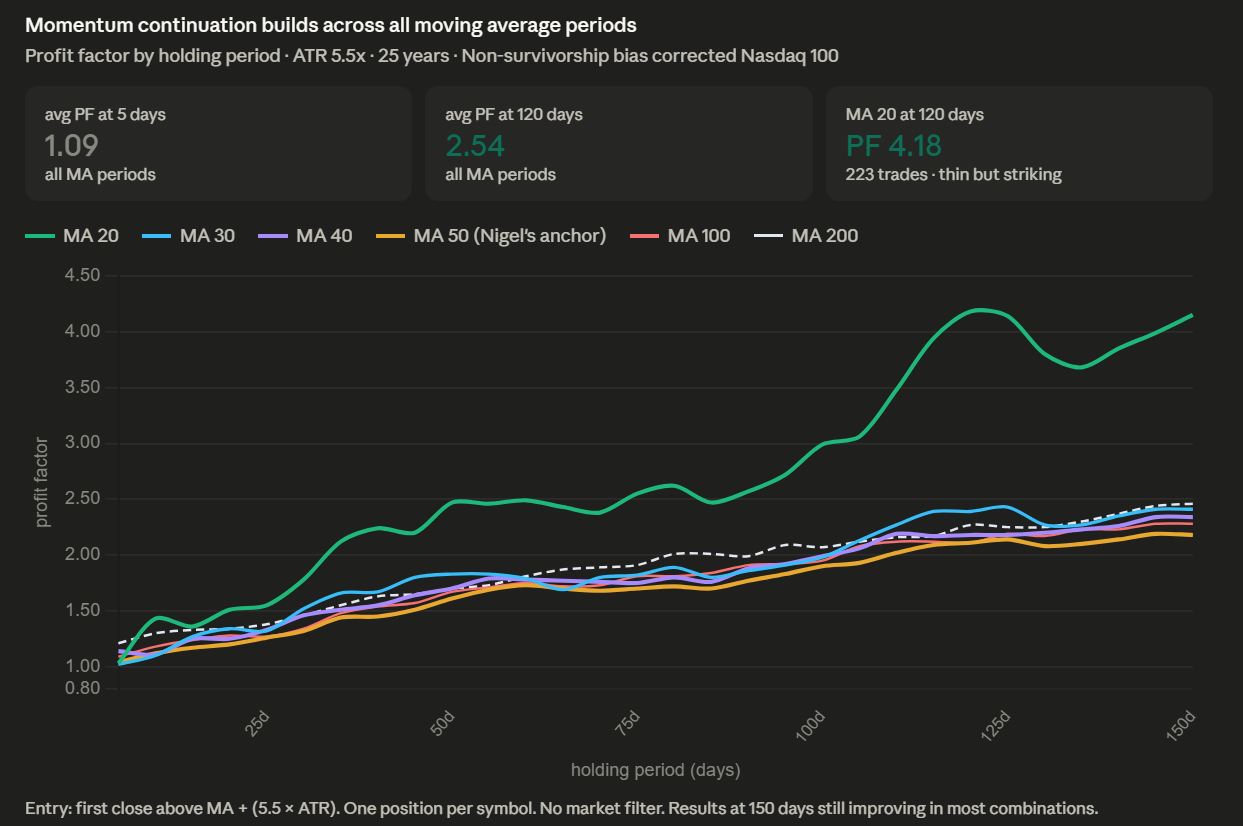
The ATR multiplier tells an equally clean story. Higher multipliers produce stronger results but with fewer triggers. At 1.0x ATR extension the signal fires thousands of times per year across the Nasdaq 100 universe. The results are real but modest. The signal barely separates from random entry at most holding periods. As the multiplier increases the frequency drops and the quality rises. At 5.5x the trade count is in the hundreds to low thousands depending on the MA period. Results at 120 days are meaningfully above random entry. At 7.0x to 7.5x, squarely in the zone Nigel identified as statistically significant, trade counts drop to the low hundreds but the results at 120 days are dramatically above the baseline.
That tradeoff is worth understanding clearly. A trader using a 7.5x ATR multiplier on the 50 SMA is waiting for a genuinely rare setup. Across the entire Nasdaq 100 universe over 25 years that combination triggered around 400 times at the 5 day entry point. That is roughly 16 per year across hundreds of stocks. When it triggers the data says it is worth paying attention to. But it is not a high frequency approach. It is a quality filter for genuinely exceptional momentum conditions.
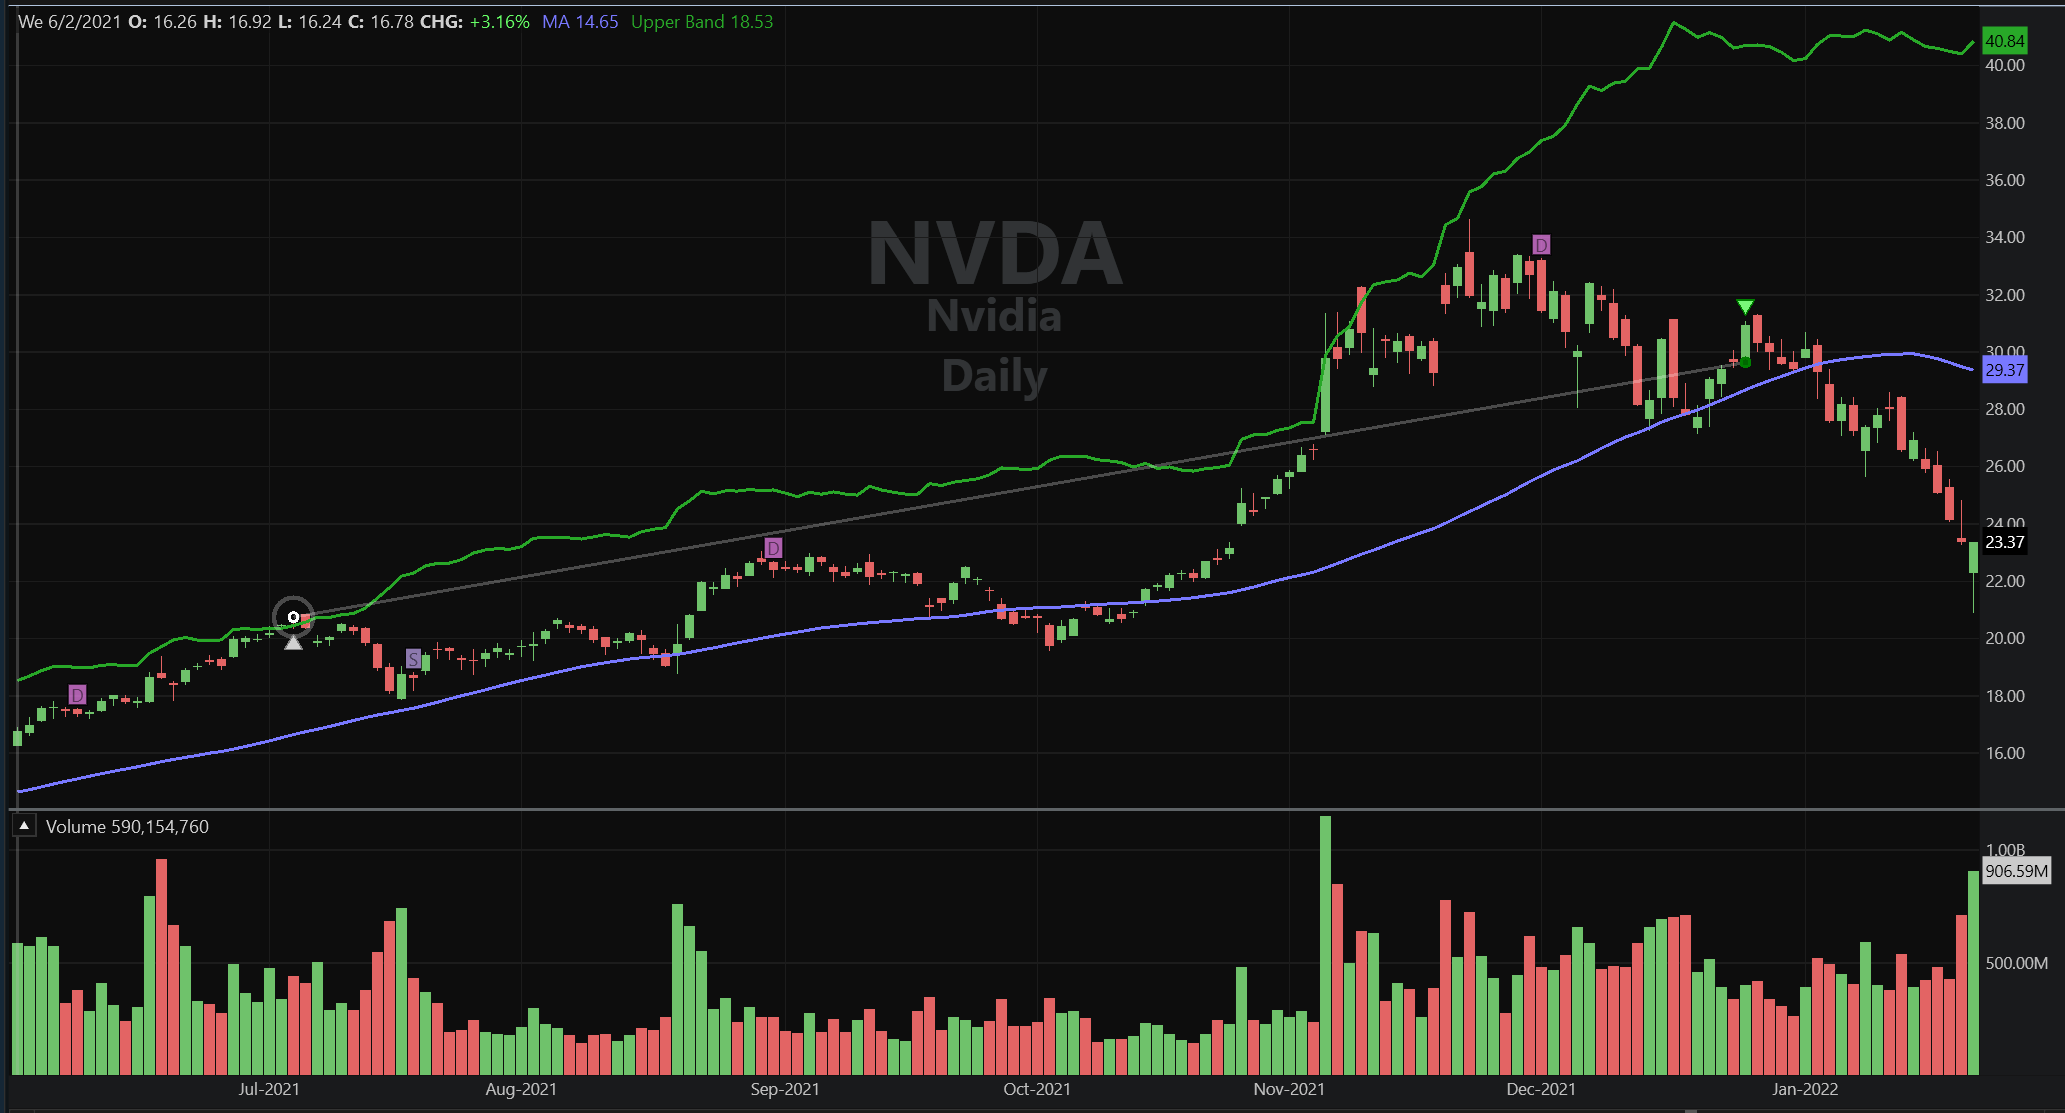
NVDA using a 7.5x ATR extension from the 50 period moving average and holding a static 120 days
The practical question is how to use this. The short answer is that this research is a starting point not a complete trading system. A complete system requires position sizing, stop methodology, portfolio heat management, and exit optimization beyond a fixed holding period. None of that is addressed here. What is addressed is a specific question about what happens after a stock crosses above a significant ATR extension level. The data is consistent. Short term these stocks consolidate. Medium to longer term they tend to keep going. The stronger the extension the stronger that tendency.
Rather than present a static table of every combination I built an interactive tool where readers can explore every MA period, ATR multiplier, and holding period themselves and see the profit factor, win rate, average winner and average loser for that specific combination. It also shows the trade count with a frequency rating so the statistical weight of each result is immediately visible.
The tool is here: https://www.tradingtimemachine.com/atr-extension-study.html
Nigel’s original article asked whether the ATR extension heuristic was backed by data. It is. This study asks what happens next. The answer depends on how long you hold and how extreme the extension is. Short term the caution is warranted. These stocks pause and consolidate after the breakout. But the traders who dismiss them entirely based on short term behavior are missing the longer term picture. Strong stocks stay strong. The data across 25 years and 2,250 parameter combinations is consistent on that point. This is trend following expressed through a momentum quality filter. The extension is not a warning to stay away. It is a signal that something unusual is happening in that stock. Whether you act on it and how you manage it is your decision. The data just tells you what has historically happened next.
If you want to see what systematic research like this looks like built into a complete tradeable system that work is at Trading Time Machine
Dave Johnson
Quant Developer at TradingTimeMachine.com