
Does Buying Weakness Still Work When the Trend Weakens? 25 Years of Data
Part 2: The edge survives early deterioration. But where it lives changes.

The Edge Shifts: What Happens When the 20 Crosses Below the 50
In the first article, we tested a simple question: in a fully bullish stock alignment, is it better to buy weakness or wait for confirmation?
The answer was pretty clear. Buying on the cross under outperformed waiting for the cross over in 17 of 18 RSI zones across 25 years of Nasdaq 100 data.
A fully bullish alignment means the 20-day moving average is above the 50, the 50 is above the 200, and SPY is trading above its own 200-day moving average. In other words, everything is stacked in bullish order and pointing in the same direction.
This time, we’re testing a different condition.
The 20-day moving average has now crossed below the 50. The 50 is still above the 200, and SPY remains above its 200-day moving average. So the longer-term structure is still intact, and the broader market is still healthy, but early weakness has started to show up in the stock itself.
Same question, different market structure.
What happens now?
Here’s what the data says.
The Test Setup
The methodology here is identical to the first article.
The test uses 25 years of Nasdaq 100 data, run in Wealth-Lab with data from WealthData, a clean daily bar source screened for bad ticks and other data anomalies. Entries are taken at the next day’s open after a signal fires, with a fixed 5-day holding period.
The universe is unchanged: NVDA, AMZN, TSLA, and the rest of the Nasdaq 100.
We again use a 7-period RSI, tested across clean 5-point landing zones. For each zone, a cross under entry occurs when RSI moves down through the upper boundary and closes above the lower boundary. A cross over entry occurs when RSI moves up through the lower boundary and closes below the upper boundary.
Both setups place the entry in the exact same 5-point RSI zone. The only difference is how price got there: momentum fading into the zone versus momentum strengthening into it.
One important note before looking at the results: some zones in this alignment have relatively low trade counts, especially at the highest RSI readings. Sample sizes get thinner at those extremes, so those results should be viewed with a little more caution.
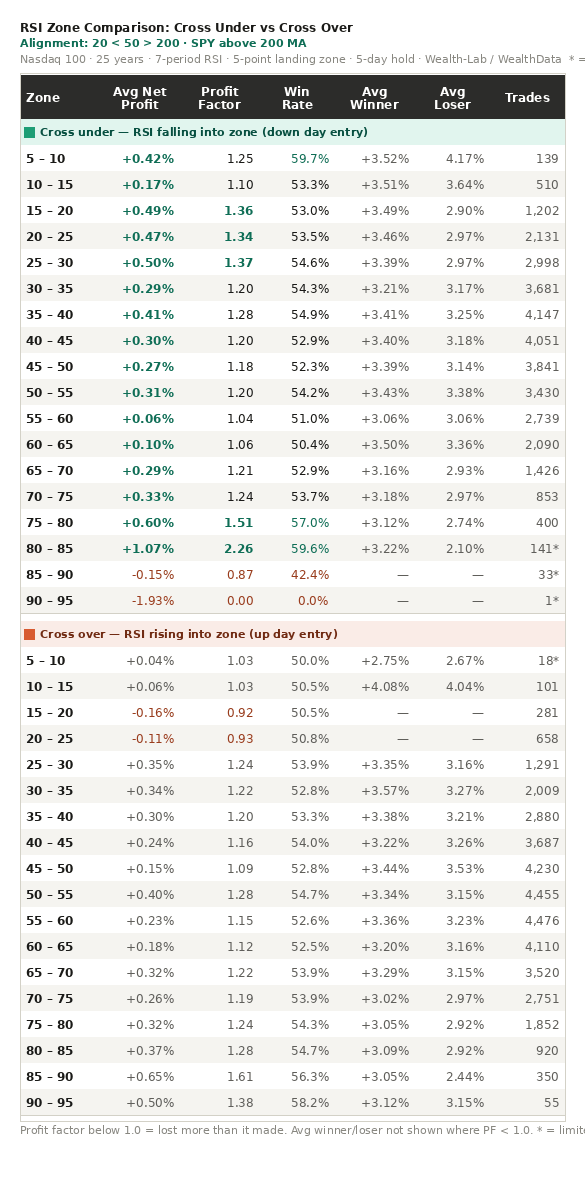
The full dataset is included so you can evaluate the numbers for yourself.
What the Data Shows
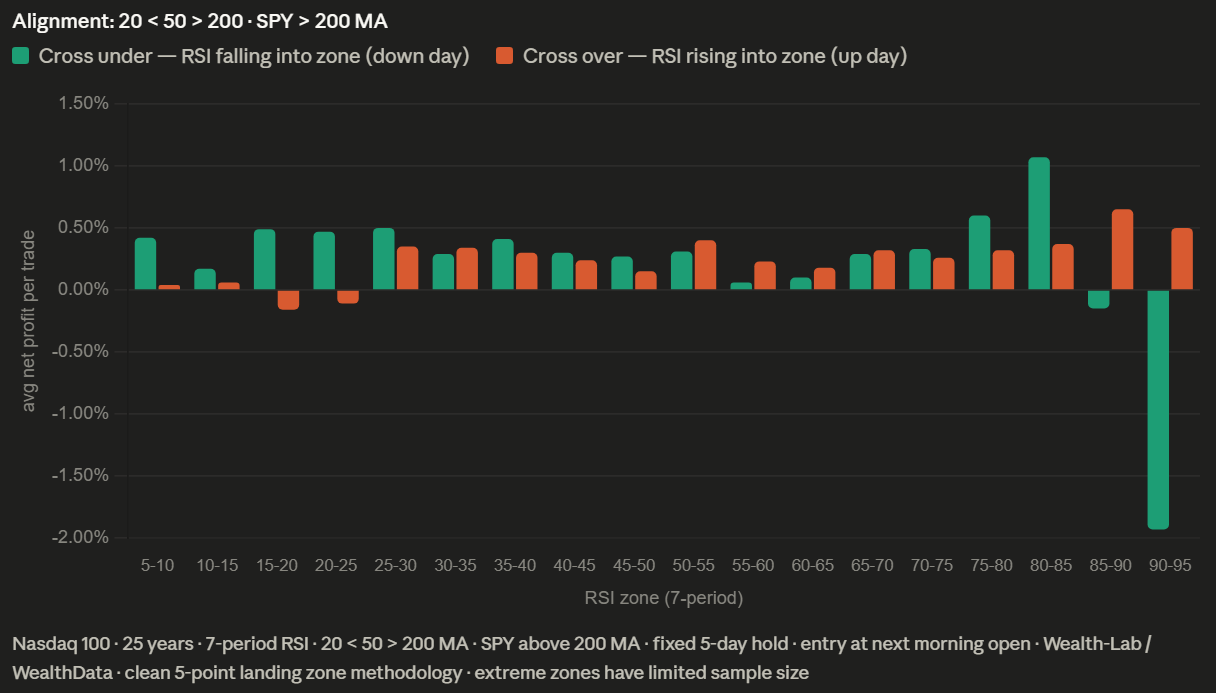
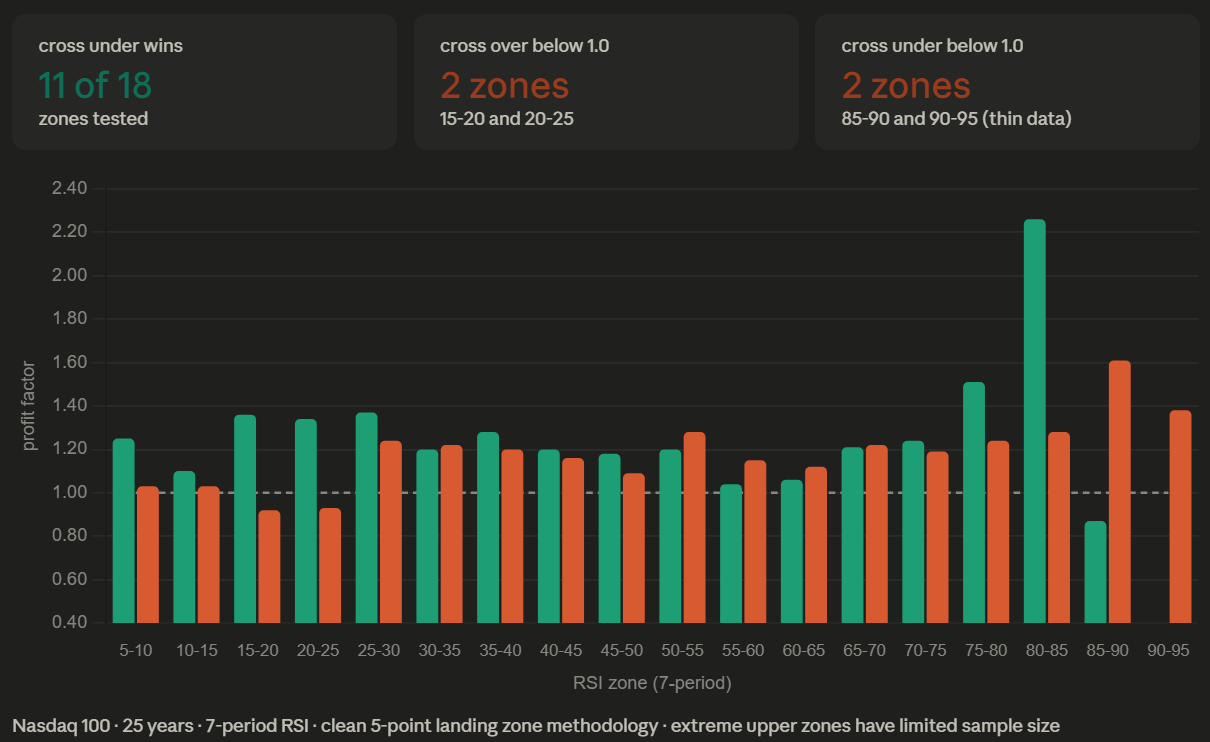
Cross under outperformed cross over in 11 of 18 RSI zones. That’s a noticeable drop from the 17 of 18 zones seen in the fully bullish alignment.
The edge is still there, but it’s clearly weaker.
In the lower RSI zones, the pattern largely holds up. In the 15 to 20 zone, cross under produced an average net profit of 0.49%, a 1.36 profit factor, and a 53.00% win rate across 1,202 trades. Cross over in the same zone lost money, with an average net profit of -0.16%, a 0.92 profit factor, and a 50.53% win rate across 281 trades. A profit factor below 1.0 means the strategy lost more than it made.
The same dynamic appears in the 20 to 25 zone. Cross under remained profitable at 0.47% with a 1.34 profit factor, while cross over posted a -0.11% return and a 0.93 profit factor.
The middle RSI zones are where things begin to change.
Unlike the first article, cross over starts to gain an edge around the 50 to 55 zone. By 55 to 60, it leads cross under by 0.17%. In the 60 to 65 zone, the lead is still present, though smaller at 0.08%. As RSI climbs higher within this weaker alignment, the advantage of buying weakness begins to fade.
The 80 to 85 zone is interesting enough to call out separately. Here, cross under generated a 1.07% average net profit, a 2.26 profit factor, and a 59.57% win rate. The catch is sample size: just 141 trades over 25 years. Promising, but not robust.
Beyond that, the data gets too thin to take seriously. The 85 to 90 zone has only 33 cross under trades, and the 90 to 95 zone has exactly one. That’s not analysis anymore, that’s statistical cosplay.
The one real exception in the lower range is the 30 to 35 zone, where cross over edges out cross under by just 0.05%. Given the sample sizes—3,681 cross under trades versus 2,009 cross over trades—that difference is effectively noise. Neither setup shows a meaningful advantage there.
How This Compares to the Fully Bullish Alignment
In the fully bullish alignment, cross under dominated across nearly the entire RSI range. Here, that advantage becomes more selective.
Instead of working almost everywhere, the edge now clusters in the lower RSI zones and gradually disappears as RSI moves higher. A direct comparison makes the shift obvious.
At the lower end, the results are remarkably similar to article 1. In the 20 to 25 zone, the cross under profit factor comes in at 1.34 versus 1.28 in the fully bullish alignment. In the 25 to 30 zone, it’s 1.37 versus 1.38. In other words, very little has changed where the stock is already showing deeper short-term weakness.
Higher up the RSI scale, the behavior changes materially.
In article 1, cross under maintained a clear advantage all the way through the 75 to 80 zone. Under this weaker alignment, cross over begins outperforming as early as the 50 to 55 zone and continues to show strength from there. That is a meaningful change in market behavior.
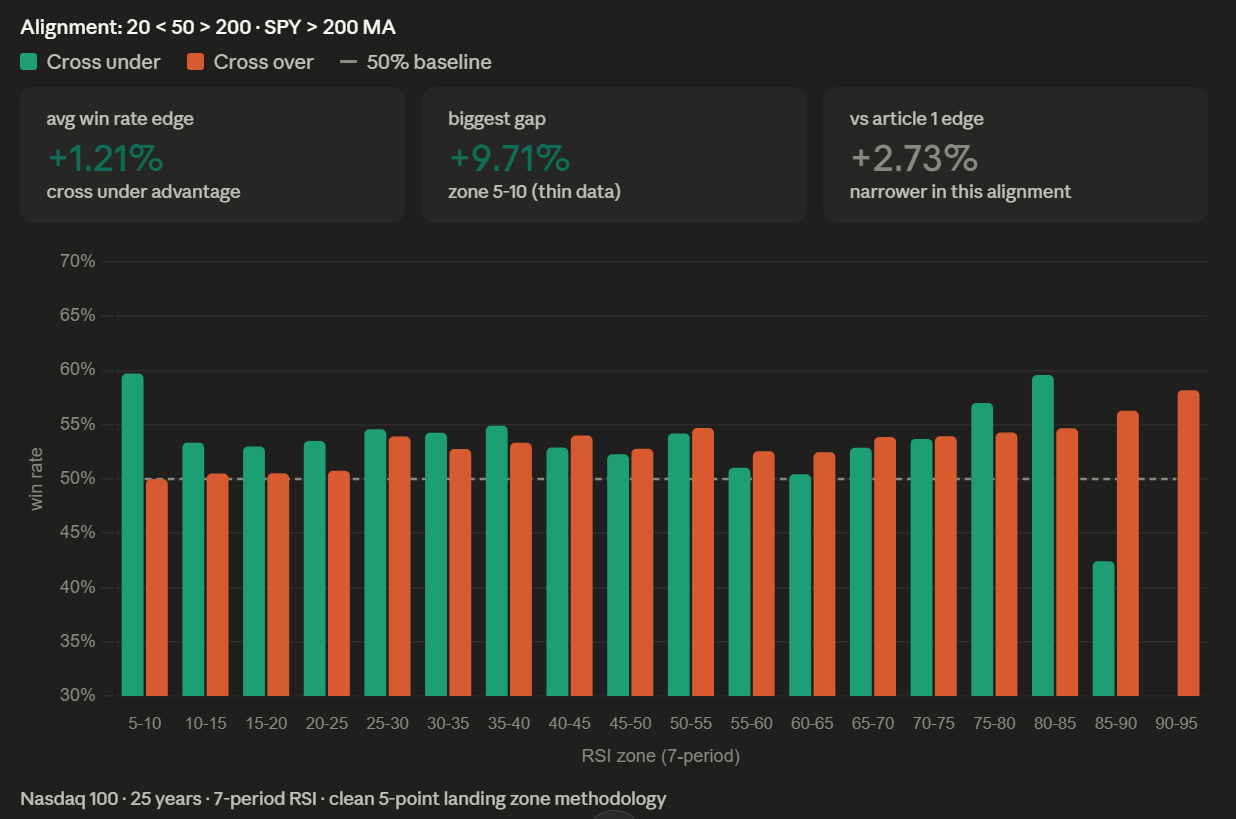
Win rates tell the same story. In the lower zones, cross under still posts win rates in the 53% to 55% range, broadly in line with the fully bullish test. As RSI rises, that advantage compresses and in several zones reverses entirely.
One additional detail stands out in the comparison: both average winners and average losers are modestly larger across several zones versus article 1.
That’s consistent with what you would expect from a stock showing early structural deterioration. Over a 5-day holding period, price swings widen in both directions.
Frequency and Exposure
The question is unchanged from article 1: does buying weakness (cross under) outperform waiting for confirmation (cross over) within the same RSI zone?
Lower RSI (15–25)
Cross under maintains a clear and consistent edge.
Profit factors remain above 1.30, with positive average returns and win rates in the low-to-mid 50% range. Cross over is negative across the same zones.
This is the most stable part of the distribution and closely matches the fully bullish alignment results.
Middle RSI (25–50)
The edge compresses but does not disappear.
Both approaches remain viable, but cross under holds a modest advantage through roughly the 45–50 zone. Differences are smaller and less consistent than in the lower band.
This is where the first structural shift becomes visible relative to article 1.
Upper RSI (50+)
The edge changes.
Cross over begins to outperform cross under as RSI rises further into upper territory. In this alignment, cross under signals become less frequent and less reliable once RSI reaches elevated levels after the 20/50 crossover has already occurred.
Frequency Considerations
High RSI readings in this alignment are structurally less common. Once the 20 has crossed below the 50 while SPY remains above its 200-day, sustained moves into high RSI zones are rarer.
As a result, upper-zone cross under signals are both lower frequency and thinner in sample size, which naturally reduces the stability of those results.
Takeaway
Where sample size is sufficient, the same core finding from article 1 holds: cross under carries a persistent edge in lower RSI conditions during a healthy broader market. That edge degrades as RSI rises and eventually flips in higher zones under this alignment.
Two articles in. Two alignment conditions tested. The pattern is consistent.
In a fully bullish alignment, cross under outperformed cross over in 17 of 18 RSI zones across the full range. In early deterioration—where the 20 has crossed below the 50 but SPY remains above its 200-day—the edge is reduced but still present, with cross under winning in 11 of 18 zones. The advantage shifts rather than disappears, concentrating in lower RSI conditions and fading above 50.
A note on interpretation.
All results include every qualifying signal across the Nasdaq 100 universe over the full test period. There are no portfolio constraints, position caps, or capital allocation rules applied. This is intentional. The objective here is to isolate entry timing behavior across the full distribution of signals. Portfolio construction is a separate layer.
This is not a complete trading system. It is a controlled test of a single decision point: entry timing across defined RSI zones under different market alignments. Position sizing, risk limits, exits, and portfolio heat are not part of this analysis.
The result itself is consistent across both studies. Buying weakness (cross under) continues to outperform waiting for confirmation in the lower RSI ranges, particularly where signal density is highest. That is where the statistical edge is most stable.
The implication is narrow but clear: under multiple market structures, the distribution of outcomes favors early entry in oversold conditions rather than confirmation-based entry.
If you want to see what this kind of research looks like built into a complete tradeable systems, that work is at TradingTimeMachine.com.
Next up: the same test with the 20 below the 50 and the 50 below the 200. The fully bearish alignment. And this time we look at the long and potentially short side in poor ranges. Does buying down beat waiting for confirmation when everything points down? The data will tell us.
Dave Johnson
Quant Developer at
Excellent follow-up.
What I like here is that the edge does not simply disappear when the trend weakens. It changes location.
That feels more useful than a simple yes/no answer.
I’m building AI-assisted FX bots from Japan, and this is exactly the kind of regime-aware testing I want to think more about. A rule that works in one alignment may still work in another, but only in a narrower part of the distribution.
The key lesson for me is that the system should not just ask “does this signal work?” It should ask “where does this signal still work, and where does it stop working?”
Looking forward to the fully bearish alignment test.