
When Volatility Is Primed to Move: Introducing VIX Kinetic
A mechanical signal built to identify short-term volatility expansions before they become obvious.

Introducing VIX Kinetic
I have spent a great deal of time studying volatility and building systems around it. Over the years, I have used volatility signals to make short-term adjustments to portfolios, trading systems, and long-volatility positions.
The question that led to VIX Kinetic was fairly narrow. Can we identify, at the end of the day, when the odds have shifted in favor of a short-term rise in VIX?
The goal was not to predict a crash. It was not to call a market top or explain why investors should suddenly become bearish. I wanted to know whether there were repeatable conditions where VIX had become sufficiently compressed that a short-term rebound was more likely.
The answer, at least historically, was yes.
The Historical Record
From March 1999 through July 2026, VIX Kinetic produced 338 historical signals. VIX finished higher under the system’s defined exit rules on 87.9% of them.
The average positive move was 8.9%. Winning signals were held for an average of 4.7 trading days. Losing signals averaged -5.33% and lasted an average of 12.34 days. The system was historically good at identifying quick volatility rebounds. The Signal has a maximum active window of 22 days.
Those numbers describe the movement of the VIX Index itself. They show that the system historically identified a repeatable short-term tendency in volatility, not an expressed trade. VIX is an index not a directly tradeable asset.
The strongest entry regime was when VIX began between 15 and 18. In that range, 92.2% of signals finished higher, the average VIX result was 9.48%, and resolution tended to be quicker than in signals that began with VIX already elevated.
That matters because it supports the central idea behind the system. The better opportunities often appeared before fear was obvious, not after volatility had already expanded.
You can see the complete picture in two places on the site: the System Page, for how the system works, and the Full Signal History, for every one of the 338 signals, dates and VIX levels included.
System Market Conditions
What makes the signal interesting is where it tends to appear. VIX Kinetic often fires after volatility has extended lower inside an otherwise quiet market. Fear is not obvious. The market may feel comfortable. Most traders are not looking for a volatility trade at all.
That is precisely the point. The system does not wait for volatility to begin rising before recognizing it. It looks for the conditions from which a short-term VIX rebound has historically become more likely.
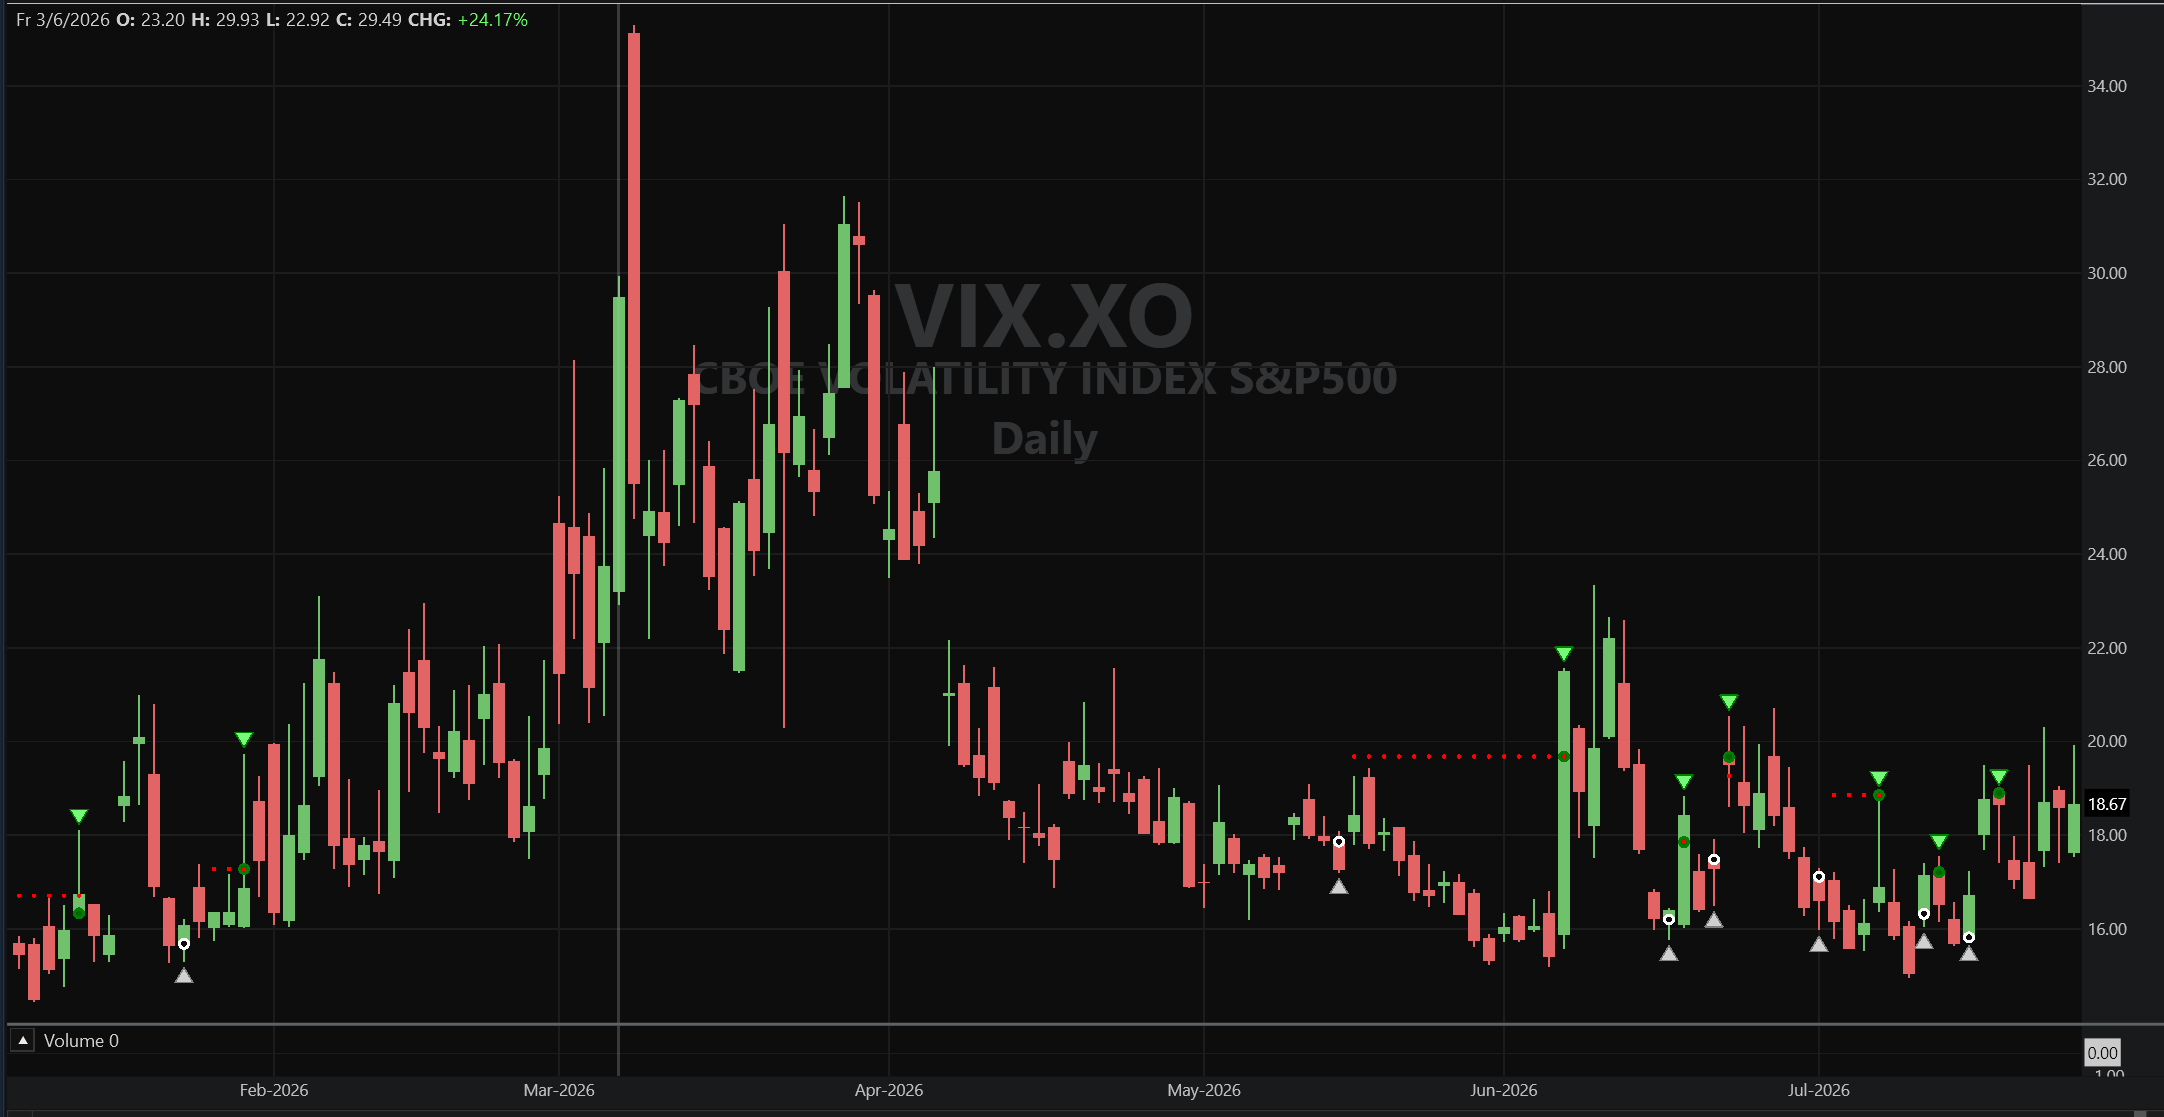
Multiple signals can occur in close succession without requiring a major market event.
It Is Not a Crash Predictor
The system is not forecasting a market collapse every time it fires. It is forecasting a relatively moderate, short-term rise in VIX.
That narrow objective is part of why the signal is useful. A modest VIX pop can still:
change option pricing
widen intraday ranges
pressure high-beta stocks
weaken crowded momentum names
improve the setup for a short candidate
make new long exposure less attractive
While in a signal, most periods, though not all, will carry an intraday VIX target of 10.2%. That target is set the evening before, along with everything else. Nothing about the trade is decided after the market opens.
The Signal Is Useful Even Without Trading VIX Derivatives
You can use it to:
reduce long exposure
delay a purchase
tighten risk
time a short candidate
avoid chasing momentum
simply become more selective for a few sessions
Options Are Probably the Most Approachable Expression
For most traders, VIX options will probably be the most approachable way to express the signal. A long call offers defined premium risk, while a call spread can reduce the upfront cost and still participate in the type of short-term VIX move the system was designed to identify.
The synthetic options study suggested that a 35 DTE at-the-money call produced a 77.2% positive rate, an average return of 24.3%, and a median return of 30.7%. A call placed roughly one VIX point in the money produced a 78.1% positive rate, a 21.9% average return, and a 29.7% median return. The defined-risk call spread showed an 82.8% positive rate, with a 16.5% average return and a 23.9% median return.
Those figures need to be understood correctly. They come from a synthetic pricing model, not from historical option-chain quotes, and they are not realized performance claims. They are also averages built from a full range of outcomes, including trades that lost most or all of the premium paid, not just the winners. Real results will depend on the corresponding VIX futures contract, implied volatility, time decay, strike selection, expiration, bid-ask spreads, and execution. A correct VIX forecast can still produce a disappointing option trade if the contract is too expensive, too far out of the money, or too close to expiration.
That is why I created a separate implementation manual, included with purchase. It does not present one required trade. It explains how different structures may respond to the same signal, why longer-dated ATM or slightly in-the-money calls may provide a practical starting point, and where call spreads or shorter-dated rolling approaches may fit for more experienced traders.
Futures Are Cleaner but Probably Not for Most
Experienced and well-funded traders may prefer VX or VXM futures because the exposure is more direct and linear. But they bring leverage, margin, overnight risk, and contract-selection risk that options don’t. Options remain the more approachable starting point for most members. Futures are there for the traders who already know what they’re taking on.
The Signal Is Mechanical
After the market closes I update all relevant data and generate the signal for the next day. That signal posts each evening to the password protected page on the site. A quick check gives you what you need to navigate the short to medium term.
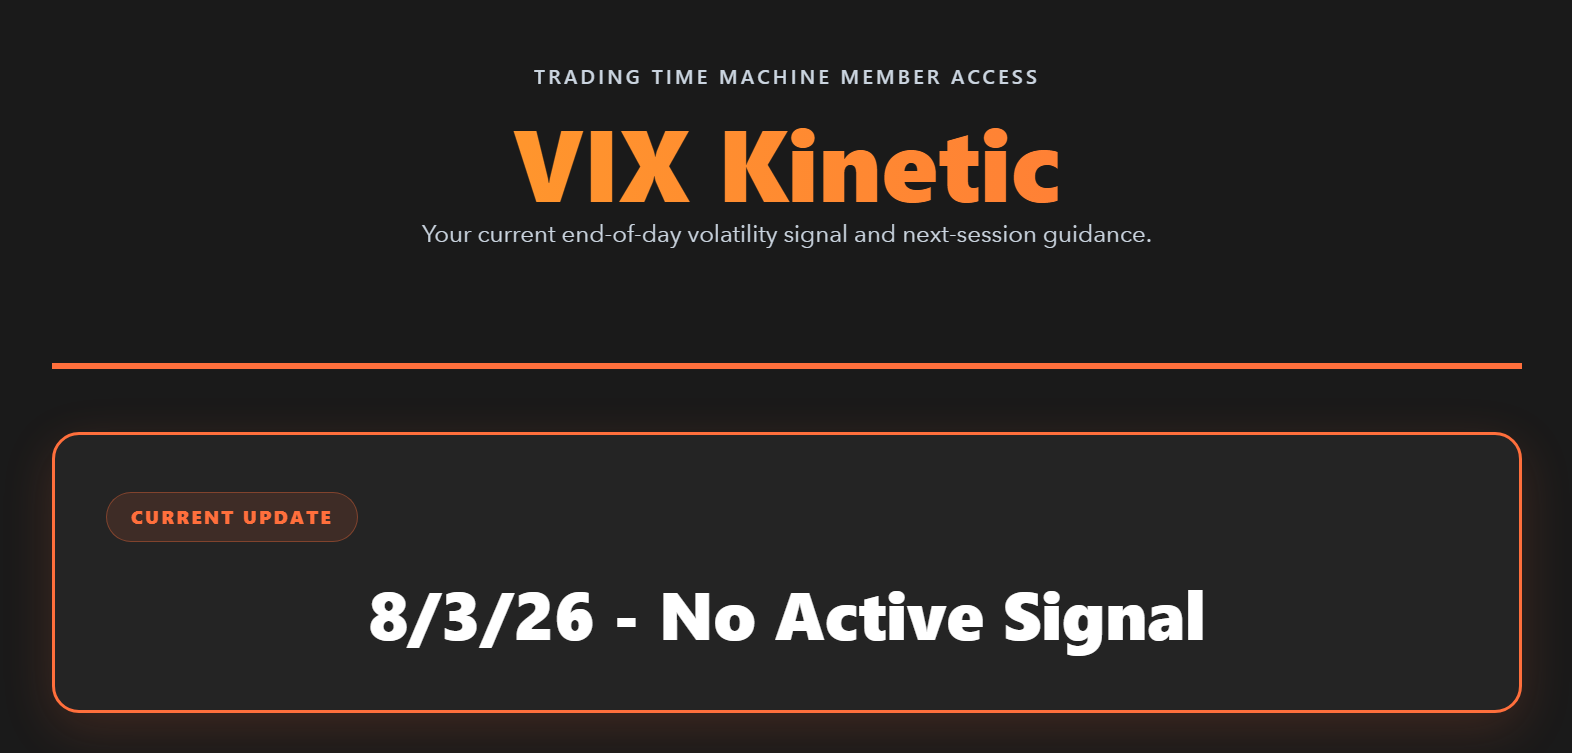
If the market is already in a higher volatility regime, the system will generally not fire a new signal. That’s normal. The signal requires VIX to reset to lower levels. The exit works the same way: the page will post either an exit for tomorrow or a specific VIX target level, defined the night before. The best way to get a feel for the signal is to go through the full signal history for yourself - https://www.tradingtimemachine.com/vix-kinetic-history.html
The Early Adopter Rollout
This is a soft launch. I want a core group of subscribers to test the execution, and give me honest feedback on the workflow.
I also want to be straight about the value here, because it’s a little absurd when you actually run the numbers. $97 gets you lifetime access to a signal tested against 27 years of data, the complete history so you can verify every claim yourself, and the options manual, all included. Spread that over ten years and you’re under ten dollars a year. Even after the price moves to $149, you’re still under fifteen dollars a year for something built the same way I build everything else I sell, tested first, published honestly, nothing held back.
I build systems for a living, and the same blind spot keeps showing up in almost every portfolio I look at. Plenty of plans for when things go up. Very little alpha extraction in elevated volatility or in this case extended downward volatility. That’s the gap this is built to close.
Because that feedback is worth a lot to me, I’m opening it at $97 for the next 14 days. After that, lifetime access moves to $149.
With purchase you will receive the Getting Started guide with information for accessing the signals and the Option/Futures Guide with some suggested use cases.
You can review the full breakdown, explore the suggested use cases, and secure your early access spot here: https://www.tradingtimemachine.com/vix-kinetic.html
Have a Great Weekend!
Dave Johnson
Quant Developer at TradingTimeMachine.com