
The 2-Period RSI: A Simple System That Still Earns Its Keep

Larry Connors put the 2-period RSI on the map in his 2008 book Short Term Trading Strategies That Work, co-authored with Cesar Alvarez. The core idea was disarmingly simple: use an absurdly short RSI lookback to catch deeply oversold stocks within an uptrend. Unconventional at the time but it stuck.
The Setup
Entry requires three conditions:
Price closes above the 200-period moving average (trend filter)
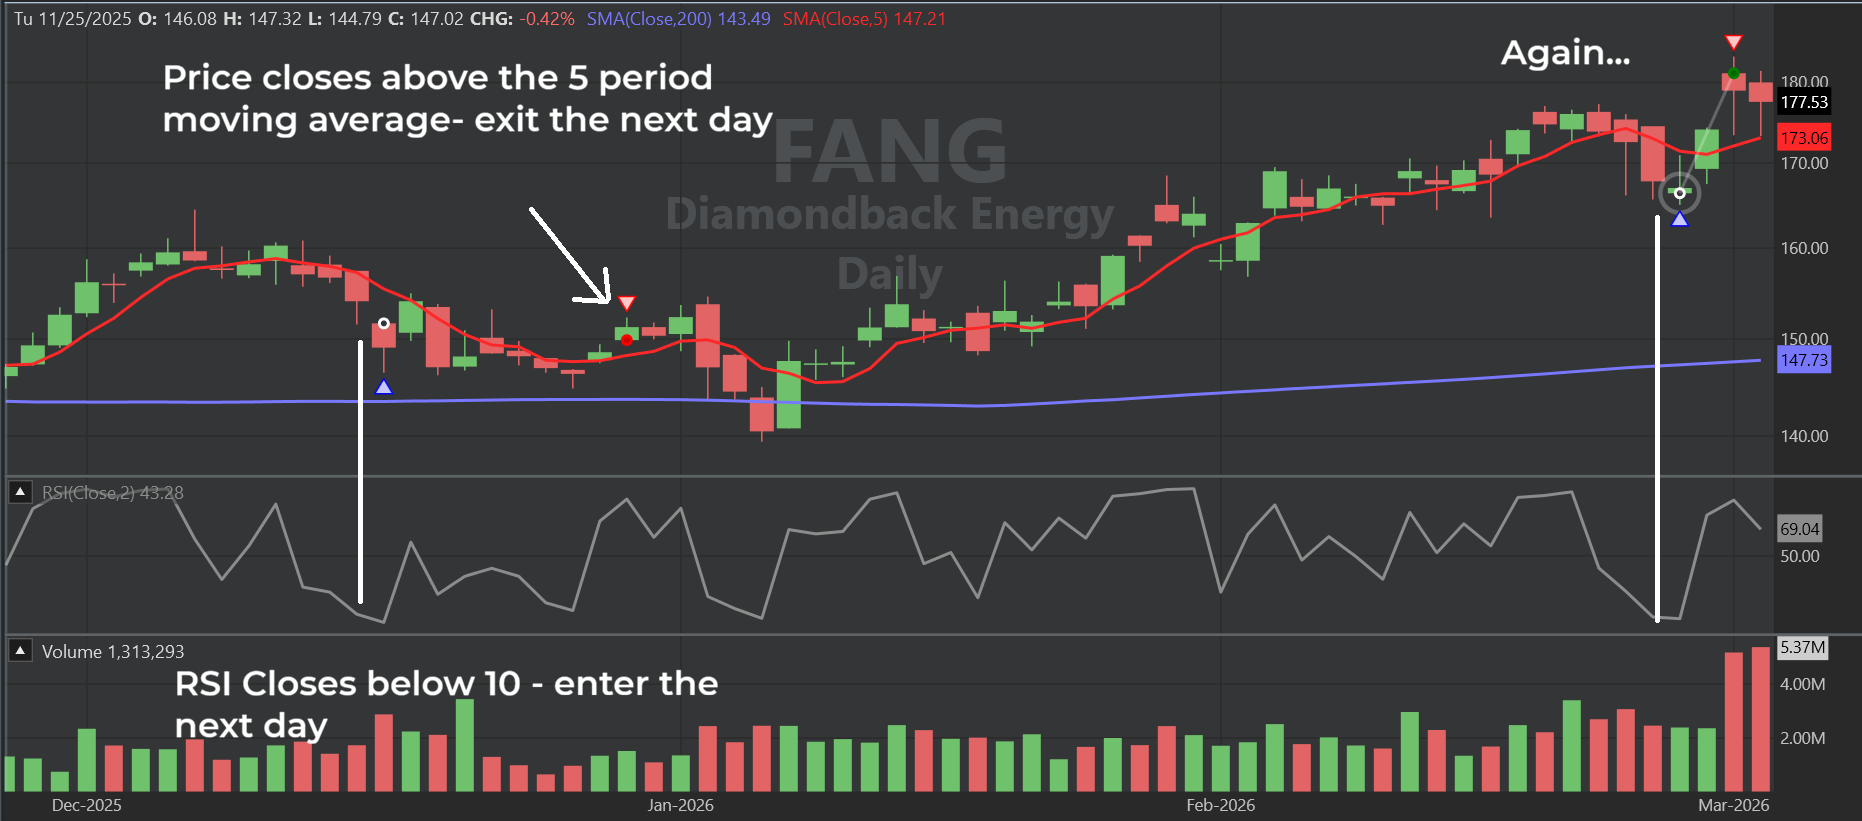
Price closes below the 5-period moving average (pulled back)
The 2-period RSI closes below 10 (oversold)
Exit is even simpler: close back above the 5-period moving average.
Here are a couple of recent examples in FANG.
The Backtest
I ran this against 20 years of Nasdaq 100 constituents (the stocks that make up QQQ), using a four-slot portfolio. When multiple symbols trigger on the same day, the system ranks by lowest RSI(2) value and chooses the ones with the lowest value.
The results:
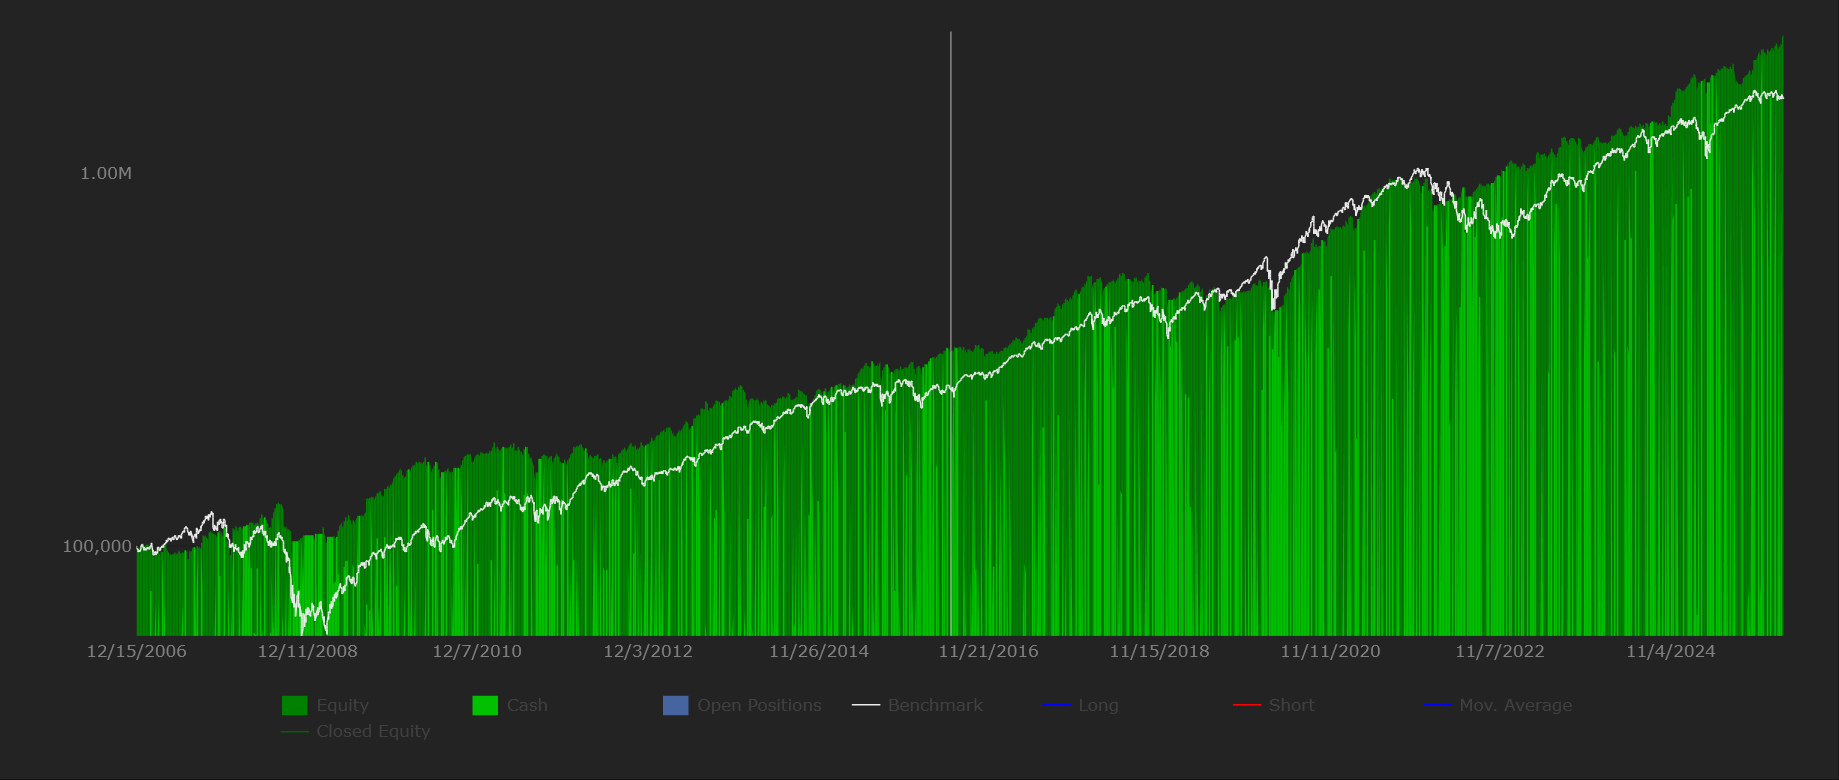
The white line is QQQ. The green path is the system. It kept pace with the market over two decades and noticeably cushioned the 2008 drawdown; not bad for four rules and an exit signal.
Trade-Level Statistics
Win Percentage: 64.33%
Average Winner: 2.33%
Average Loser: -3.02%
Profit Factor: 1.45
Annual Return: 17.84%
Maximum Drawdown: 29.15%
Sharpe Ratio: 1.10
The Sharpe above 1.0 is encouraging — it says the system earns its return without taking on the full volatility of the market. The annual return is solid.
My one concern is the Profit Factor. I generally want to see 1.65 or higher. At 1.45, the system works, but the margin isn’t wide. The math is straightforward:
(Win% × Avg Winner) ÷ (Loss% × Avg Loser) (0.6433 × 2.33%) ÷ (0.3567 × 3.02%) = 1.45
Why does this matter? A lower Profit Factor means the sequence of your trades carries more weight. If luck goes against you early, your real-world equity curve can diverge meaningfully from the backtested version. The system still works, but it has less cushion when things go sideways.
Monte Carlo: Testing the Range of Outcomes
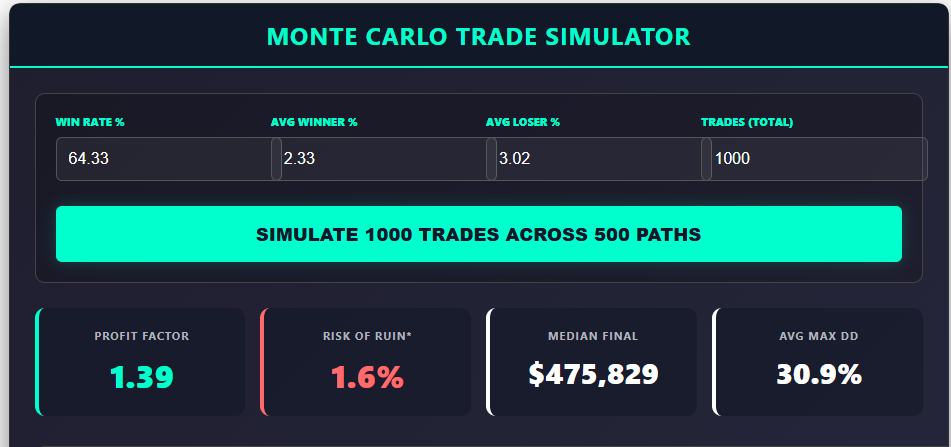
I recently added a Monte Carlo simulator to the Trader Tools page (scroll below the news widget). Plug in your Win%, average winner, and average loser, and it plots 1000 potential equity paths.
And the plot of those:
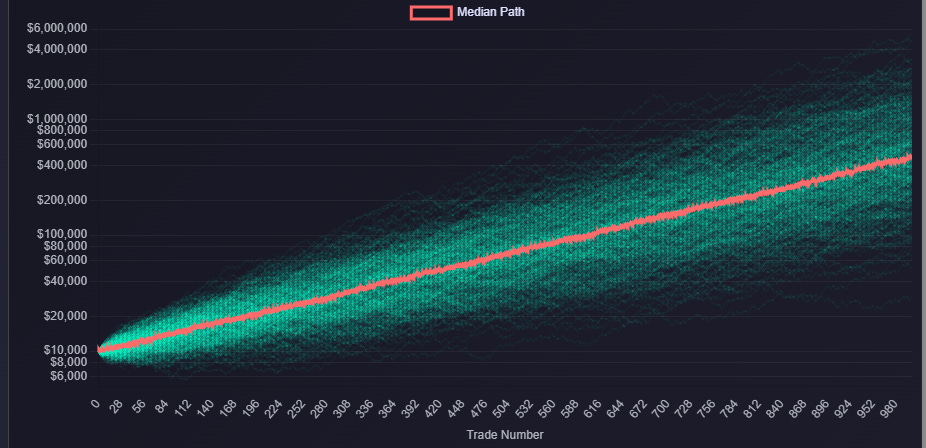
Running our trade stats through the simulator:
Median Profit Factor: 1.39 (slightly below backtest - expected)
Risk of Ruin (defined as a 50% peak-to-trough decline): 1.6%
Median Max Drawdown: 30.9% (vs. 29.15% in the backtest - nearly identical)
That close match between the simulated and backtested drawdown is a good sign. The system is behaving consistently.
What you’ll also notice in the chart: the range of final outcomes after 1000 trades is fairly wide. Better systems produce tighter fans of potential paths. A wide spread means more uncertainty about which version of the future you’ll actually experience.
Current Positions and Signals
We can take a look at the holdings it has currently and recently closed positions.
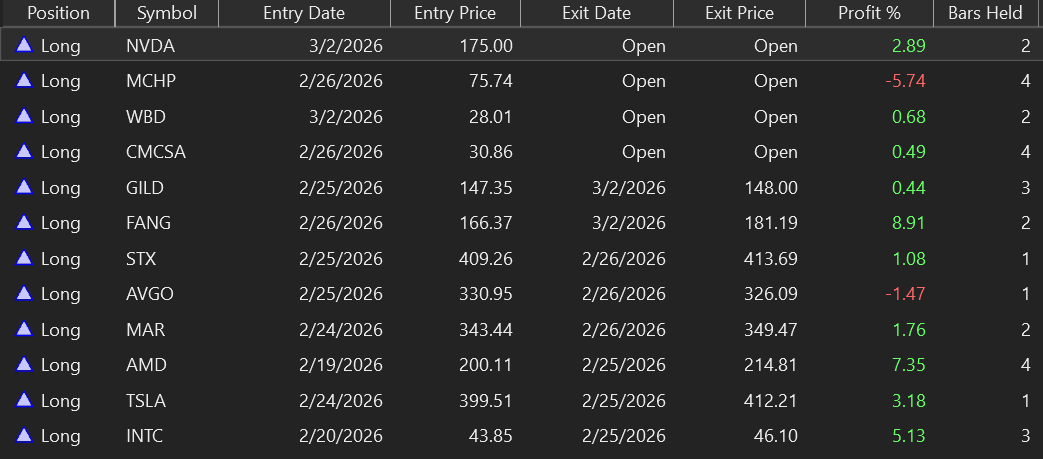
CMCSA would be an exit tomorrow as it closed above its 5 period moving average.
This would leave only one slot to add a position.
KLAC would be the selection to fill that slot based on having the lowest 2 period RSI reading of symbols that are above the 200 moving average and have the 2 period RSI below 10.
Bottom Line
The Connors settings hold up well. For a four rule system, it’s delivered an edge over two decades. But there’s room to improve We should aim for a higher Sharpe Ratio and a narrower outcome distribution. In a future post, we’ll try to build something better.
Dave Johnson - Quantitative System Designer at