
Very High RSI
Bullish or Bearish?

Today the market seems to have fooled many with a bearish outlook and continued the recent impressive run.
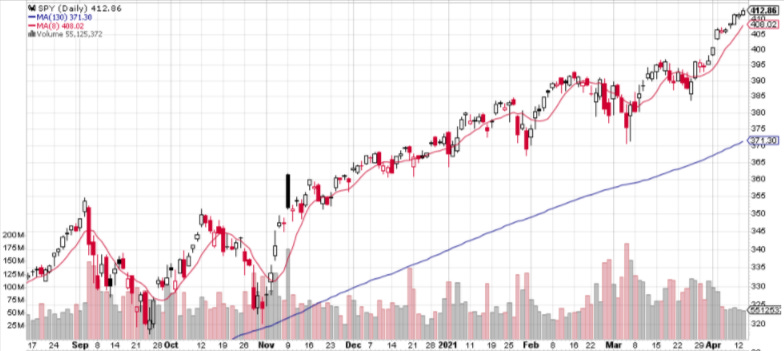
Albeit a fairly narrow range day.
The 7 Period RSI crossed above 85 today. This is not something the SP500/SPY has seen very often. The more traditional 14 Period RSI is just a tad above 73. Again, something that we have not seen very often since 1993 when the SPY began trading.
Let’s run a test with those parameters and take a look at what happened in subsequent days. I’ll also add a filter to only look at those that happened in a bullish market above the 200 day moving average - to screen out those sharp reverse thrusts we see in bear market rallies.
Below are the results of that backtest:
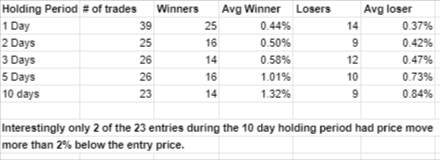
Some quick notes:
the entry is the next day at the open after the condition
the exit is end of day (for example the 1 day hold is buy the open and sell the close, 2 day would sell the next close)
All in all I would generally say that the results tend to be slightly more bullish and less volatile than many would have predicted. If you would like the trade dates and any further data related to this backtest feel free to drop a comment.
And my first post is done! You can subscribe for free to see new posts or just continue to check-in. I plan to post more detailed and informative posts on backtesting and stock research going forward. Welcome Aboard..