
Buying Weakness on the Nasdaq 100: What 1,668 Trades Say About a Strategy Nobody Recommends
Four rules, ten years, and an out of sample test through 2008

There is a trade that violates almost everything you have been taught about risk.
It buys stocks that are falling. Not stocks that have stopped falling and started to turn, which is what most people mean when they say they buy the dip. It puts a limit order below the low of a stock that just closed weak, and it wants that order filled the next day at a worse price than the one that already looked bad.
It prefers the volatile names. Not the stable ones. It screens the Nasdaq 100 for the top half by average daily range and ignores the calmer stocks entirely.
It has no stop loss. None. There is no price at which the system decides it was wrong and gets out.
And the average losing trade is bigger than the average winning trade.
Four rules. On Nasdaq 100 component stocks over the last ten years it produced a profit factor of 1.69 and an APR of 11.97% against a maximum drawdown of 8.54%.
Sit on that second pair for a moment. The annual return is larger than the worst peak to trough loss. A Calmar ratio above 1, annual return divided by the deepest drawdown, is rare across the quant space, and rarer still from a single set of rules without combining systems. When you see one, the first thing to do is figure out what is holding it up.
Those numbers come from sizing at 8% of equity per position with 2x margin available. The margin is not there to lever the account. Average exposure across the ten years is 11.4%, and total margin interest paid was 285 dollars. It is there so the test can take every signal on the rare morning when more of them fire than cash alone can cover. Why that matters is most of the second half of this article.
Survivorship bias removed. No commissions, and limit orders on both ends so slippage is close to nothing.
Then I ran it on 2007 through 2015, a period the rules had never touched. Same profit factor. Same average winner to within six thousandths of a percent.
I am not telling you to trade this. I am showing it to you because most of what gets published about mean reversion is either wrong or so heavily filtered that you cannot tell where the edge actually lives. This is the raw version. Four rules, nothing protecting it, and the full data including the parts that look bad.
THE RULES
Universe: Nasdaq 100, survivorship bias free. Every stock that was in the index on the day the signal fired, including the ones that got dropped later.
One. Rank the universe by ATRP over the last 63 bars and keep the top half. ATRP is average true range as a percentage of price. It measures how much a stock moves on a typical day. It says nothing about direction. A stock with a 3% average range is not a falling stock or a risky stock, it is a stock with more distance between its highs and lows.
Two. RSI(3) below 10 at the close. Three period RSI is fast and noisy on purpose. Below 10 is not a mild pullback. It means the stock has closed weak several sessions running.
Three. Place a buy limit 1% below that day’s low, good for the next session. If the stock does not trade there, no fill and no trade. If it gaps below, you get the open. One position per symbol at a time, so a stock already held cannot generate a second entry no matter how weak it gets.
Four. Exit on a limit 1.75% above the close, recalculated every night.
That fourth rule is the one worth reading twice. The target is not anchored to your entry. It sits above the most recent close and moves with it. Price falls, the target falls too. There is no fixed profit objective and no fixed loss objective. There is one order, sitting slightly above where the stock last closed, waiting.
Average hold across 1,668 trades is three days.
One housekeeping note. The ATRP ranking needs 63 bars of history before it can rank anything, so the first trade does not fire until November 2016. That is why the first year in the tables below shows two months instead of twelve.
Two Trades
Here is what it looks like when it goes against you. TSLA, late July 2026.
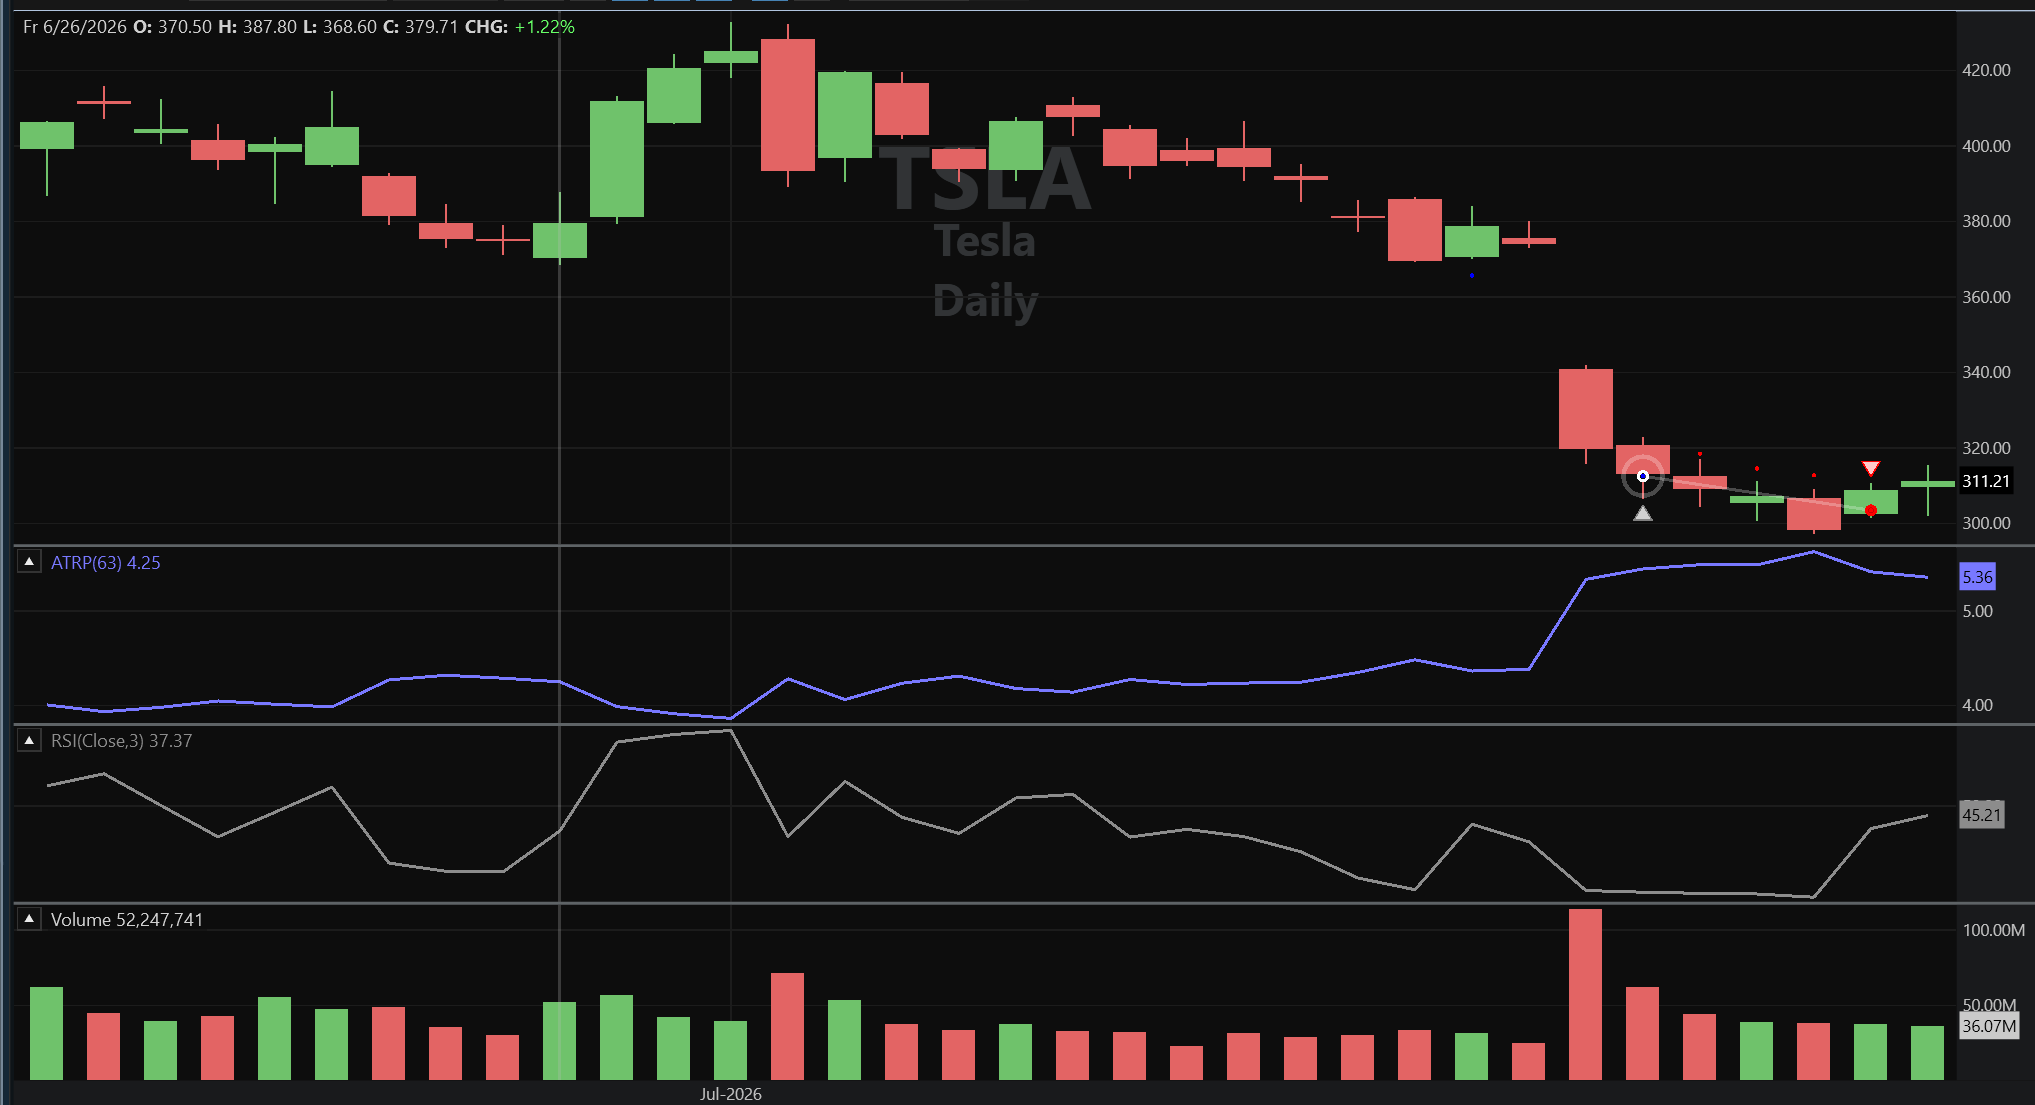
That is the mechanic working exactly as designed and losing money. The target came down to meet the price instead of waiting for the price to come up.
There is no version of this system where that does not happen. The exit is not there to guarantee a profit on any single trade. It is there to close the position fast, right or wrong, and free the slot.
The same rule produces the opposite outcome often enough to matter. SNDK, the same month.
The target sat where the red dot is, just above 1,050. The stock gapped open well past it the next morning, and a limit order does not fill at the limit when price opens through it. It fills at the open.
Entry 1,040.21. Exit 1,135.01. Up 9.11% in one day.
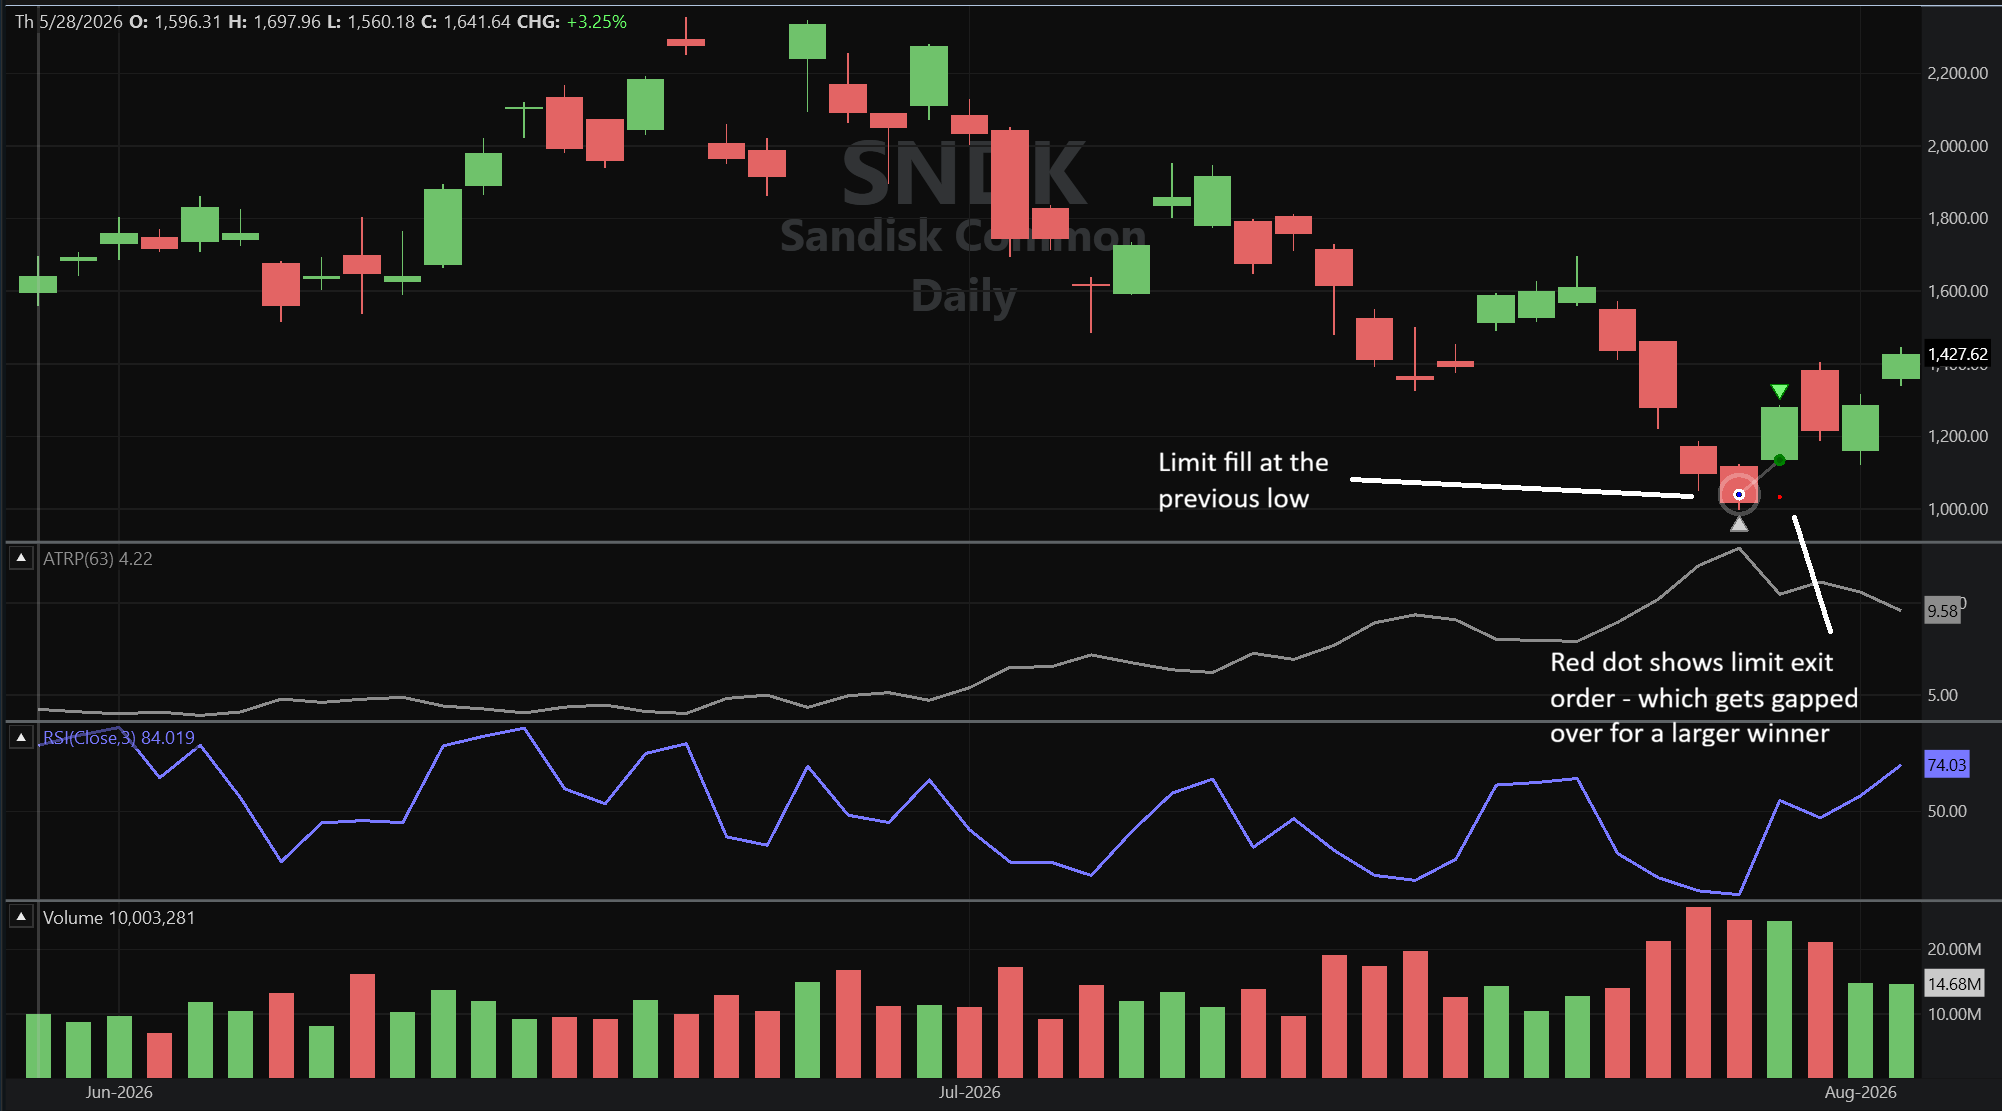
The target is 1.75% above the close. The average winning trade in this system is 3.16%.
Part of that is mechanical. Your entry sits below the low of the signal bar, and the low is below the close, so the distance from your fill to the first target is already more than 1.75% before anything moves. The rest is gaps like this one.
The exit rule caps where the order goes. It does not cap where it fills.
Results
Ten years, Nasdaq 100 components, survivorship bias free. 1,668 trades.
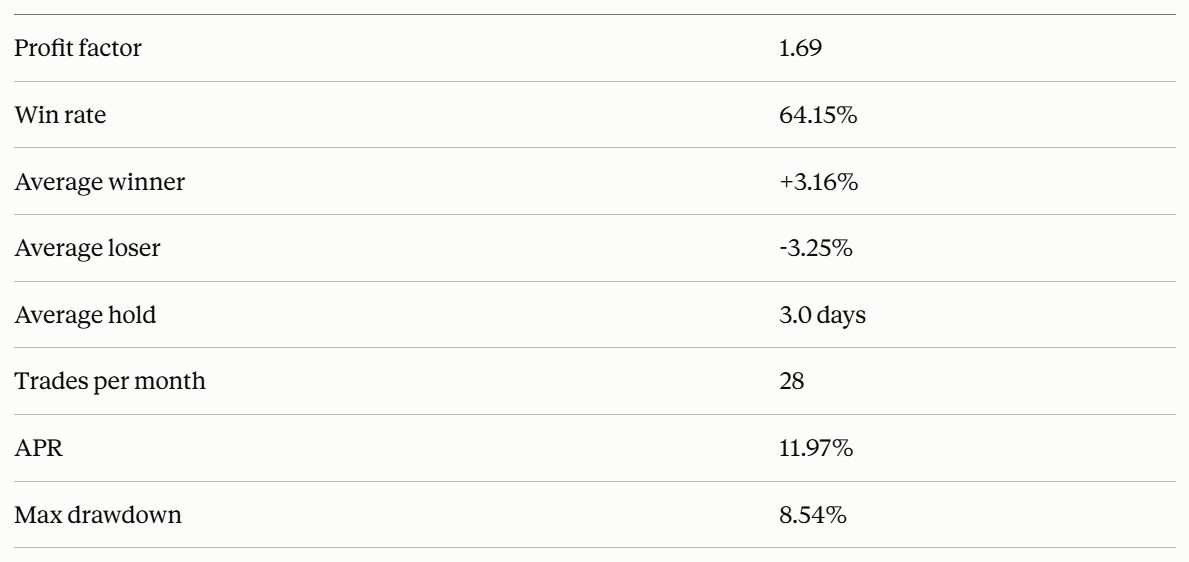
Look at the two averages. The winners are smaller than the losers.
Everything you have ever read about trading says that number needs to be the other way around. Cut your losses short. Let your winners run. Never risk a dollar to make fifty cents. That advice is in every book on the shelf and it is not wrong, exactly, but it describes one way to build an edge and people have been taught it is the only way.
There are two levers. How often you win and how much you win when you do. Trend systems win maybe 35% of the time and survive because the winners are enormous. This does the opposite. It wins 64% of the time with winners that are slightly smaller than the losers, and the frequency carries it.
Neither is better. They are different shapes, and they behave differently in ways that matter more than the win rate.
Trend systems generally carry lower risk adjusted returns. They spend long stretches giving back open profit waiting for the next real move, and the drawdowns tend to be deep relative to what the system earns per year. That is the cost of a structure that needs the occasional enormous winner. You have to sit through a lot of nothing to be there when it shows up.
This system holds positions for three days. It is idle most of the time and fully committed on a handful of days, which produces a completely different equity curve.
What matters is that the shape holds up over enough trades that you can trust it. 1,668 is enough. That is where confidence comes from, and it is the reason a bad week does not require a decision.
What It Does In Bad Markets
Here is the year by year, 2016 to now, against the Nasdaq 100.
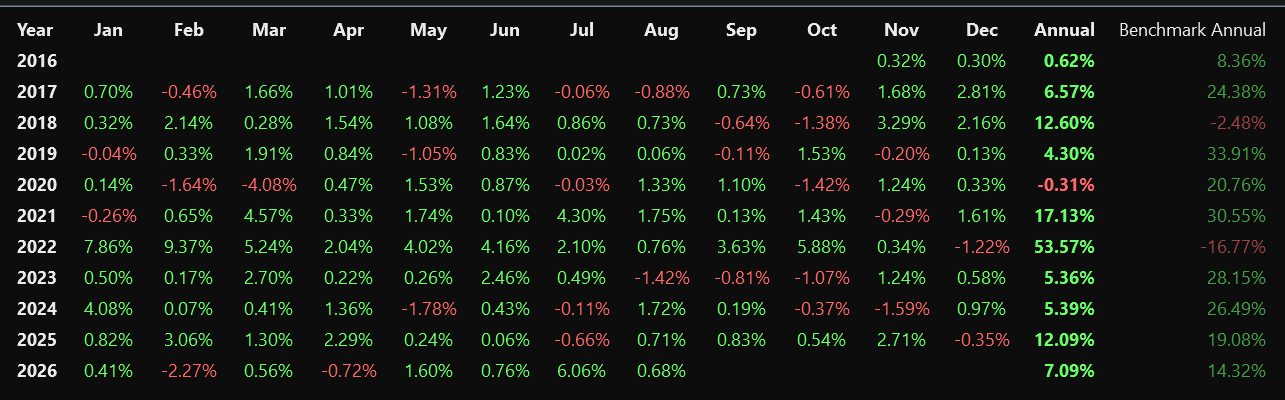
2022 returned 53.57% while the index lost 16.77%. Every month green except December.
Now look at the years running the other direction. 2019 gave 4.30% while the index ran 33.91%. 2023 gave 5.36% against 28.15%. 2024 gave 5.39% against 26.49%.
That is not a coincidence and it is not a hedge someone bolted on. It falls out of the rules.
The system needs weakness to get filled. In a bull market that runs quietly, the setups do not fire and the limit orders do not get hit. Exposure runs low. The system sits in cash. When the market breaks, three things improve at once. More stocks trigger the RSI condition. More limit orders get filled because more stocks trade below their prior low. And the ranges expand, which means the target is reachable in fewer days.
The conditions that make the trade feel impossible are the conditions that make it work.
Then there is 2020. The year returned -0.31%. The covid crash was fast, under two months, and the system took a drawdown in it. March was -4.08%. It made that back over the rest of the year and finished flat.
That happens. Worth knowing it happens before you find out live.
The Part That Actually Matters
Everything above was measured on data I used to build the thing for you. That is worth something, but not much on its own.
So I ran it on 2007 through 2015. Same four rules, same sizing, no overlap with the first test. A period the rules had never touched.
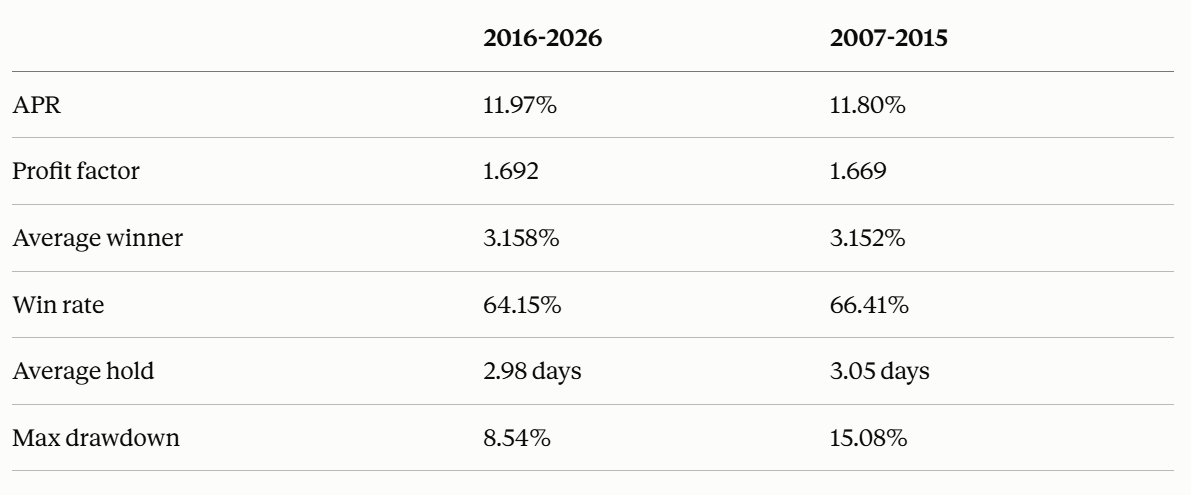
APR within two tenths of a point. Profit factor within two hundredths. The average winning trade differs by six thousandths of a percent.
Those are not close numbers. They are the same numbers.
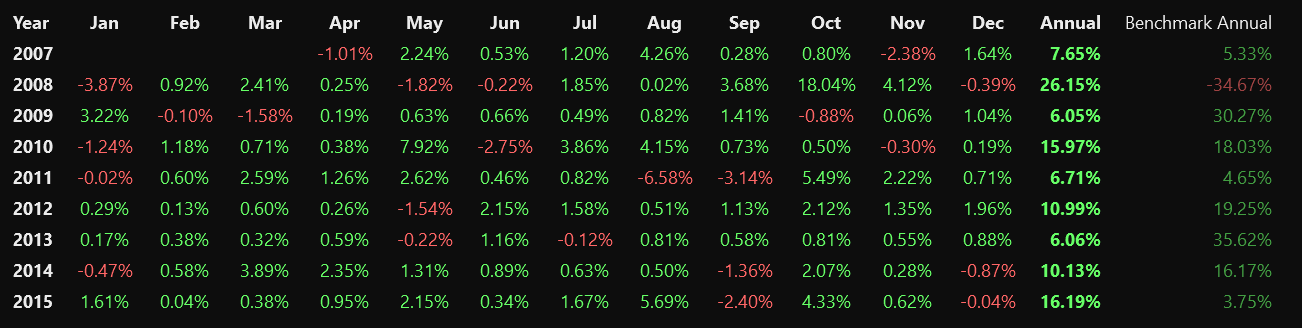
2008 returned 26.15% while the index lost 34.67%. October alone was 18.04%.
The drawdown is the only figure that moved, and it is worth being clear about what a max drawdown is. It is one event. A handful of days in November 2008 where the moves were enormous and fast. Take those days out and the other 99% of the period looks almost exactly like the recent one.
That is the part that should get your attention. Not the 2008 return. The fact that two nine year windows, one of them containing the worst market in fifty years, produced numbers this close to identical. It lends to the power of properly applied backtesting with quality data.
One more thing from that block. The standard deviation of annual returns was 6.23% out of sample against 14.24% in sample. Year to year, the results were more consistent in the period that contained the financial crisis than in the calmer one.
Every year in that table is positive.
And here is the part I cannot fully explain. This system does everything the books say not to do, and the risk adjusted numbers came out high. Not despite the unconventional construction. Somehow because of it.
There are disaster trades in here. Positions that dropped 20% and more before the target caught them. They exist and they always will, because nothing in the rules stops a stock from falling.
They do not matter because of how the position is sized. A 25% loss on an 8% position costs the account 2%. The trade is a disaster. The account barely notices. That is the entire mechanism, and it is why the sizing question in the next section is not a footnote to the strategy. It is the strategy.
The rest follows from the structure. A 64% win rate means the losing streaks stay short. Three day holds mean the account is not carrying open risk for long. This will almost never produce a spectacular year. It also cannot produce the kind of hole that ends the experiment.
I have found this element consistently through the years. The conventional approach has less built in edge than the unconventional.
Now the Part Nobody Writes About
Everything so far has been about the signal. Whether the trade works.
The signal is not the system.
Here is how I approach this, and the order matters. Start at 1% per position. At 1% across a hundred name index, the account could hold every symbol in the universe at the same time. Nothing can be refused. Every signal the rules generate gets taken.
That is not a portfolio. It is a measurement.
What it measures first is the signal itself, clean. Profit factor 1.774, average trade 0.900%, 1,673 trades, no portfolio constraint standing in the way. Whatever that number is, it belongs to the rules and nothing else.
Then it gives you the number that shapes every decision after it.
Maximum exposure at 1% per position: 24%. Twenty four positions open at the same time.
That is the peak the system ever demanded across ten years. And you have to run it unconstrained to see it. Test at any size where the account can turn a signal away and the peak is masked. The system might have wanted twenty four and you would never know, because it only ever got to take twelve.
Average exposure over the same period was 1.4%. One or two positions on a typical day. Then the market breaks and it wants twenty four.
So now you know what full coverage costs. The account has to be able to carry twenty four positions if it wants everything the rules generate. That is the number every step from here gets measured against.
Now you creep in. Step the size up one rung at a time and watch what changes.
The ladder
Same four rules at every rung. Only the position size changes.
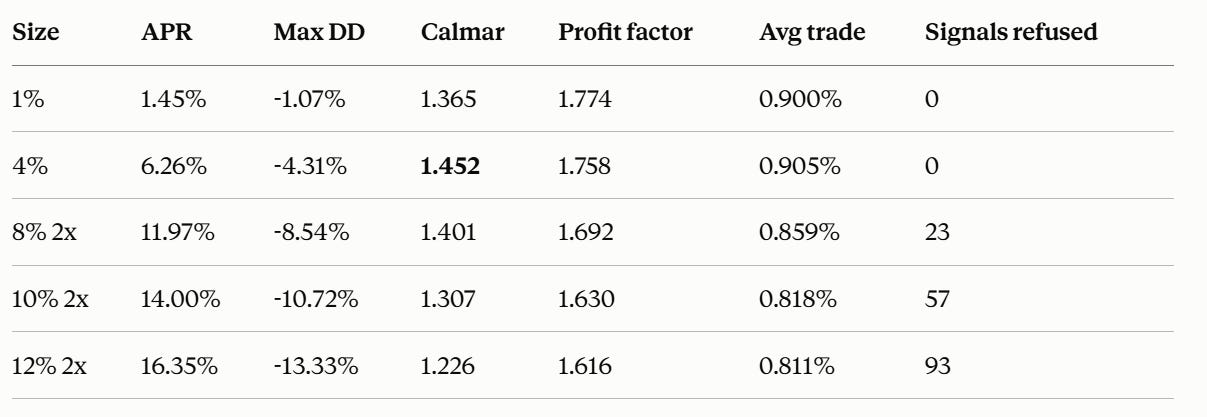
At 4% the account still takes everything. Twenty five slots against a peak demand of twenty four. One to spare. Profit factor holds at 1.758 and the Calmar peaks here at 1.452.
That is where the account runs out of room. Twenty five slots is the ceiling at 4%, and above that size there is not enough cash to cover a twenty four position morning. At 8% you get twelve positions before the account is fully invested. Half of what the system asks for on its busiest days.
So the margin comes in to buy that room back. 8% with 2x available gives you twenty five slots again. Same coverage, twice the size per position.
At 8% the first signals still start getting turned away. Twenty three of them.
Then read the last two columns down the rest of the table together.
Profit factor 1.692 at 23 refused. 1.630 at 57. 1.616 at 93.
The signal never changed. Same rules, same universe, same ten years, same entries firing on the same mornings. What changed is how many of them the account could actually take.
Two things are happening as that number climbs.
The refused signals are not random with respect to quality. They pile up on the crowded mornings, the deep flush days, which is exactly where this system does its best work. Average trade slides right alongside profit factor: 0.900, 0.905, 0.859, 0.818, 0.811.
And those same days carry the widest outcomes in both directions. On an ordinary day the system takes one or two positions and the draw never comes up. On the days it does come up, the spread between the best and worst names is enormous. So the software is not just choosing occasionally. It is choosing on the days that matter most to the final number.
What that number really is
Wealth-Lab calls it NSF, insufficient funds. Most people who see the column read it as an error log and move on.
It is not an error log. It is a count of the decisions the software made on your behalf.
When six signals fire on the same morning and there is room for four, something has to choose. Wealth-Lab picks at random from the signals available that day. That is the honest approach, because with daily bar data there is no way to know which orders would have filled first. All you have is the open, high, low and close. The sequence inside the session is invisible.
So the software rolls the dice, takes four, discards two, and reports the result as though the strategy produced it.
That is the right way to handle it. It is also why the number matters. The reported profit factor at 12% is not the system’s profit factor. It is the profit factor of one particular random draw out of a great many possible draws.
Watch what that does. Here are three runs of the same configuration. Same rules, same data, same dates, nothing touched between them.
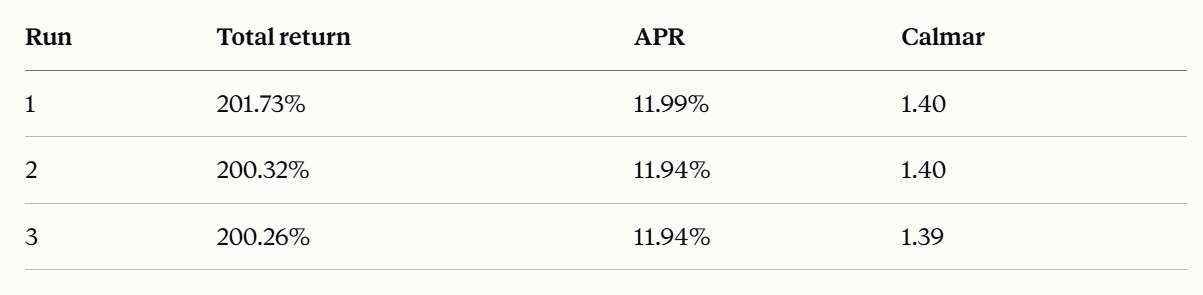
Three different answers. A point and a half of spread from twenty three unresolved fills. Small enough that you would never notice it, which is exactly why 8% is a comfortable place to sit.
Now imagine that column reading 400 instead of 23. Someone sizes at 40% per slot, sees a huge APR, and falls in love with it. Most of what they are looking at was decided by a random draw.
Why this does not show up in most backtests
Most published backtests run one symbol at a time. Every signal fills, because there is no shared account for them to compete over. That measures signal quality and nothing else.
Signal quality is worth measuring. It is just not the same question as whether you can run the thing.
This is portfolio level testing, and it is the part that separates a study from a system. A lot of the Python work getting shared publicly never gets here, not because the people writing it are careless, but because the tooling was not built to model an account with a finite amount of money and twenty four orders arriving at once.
Where the margin comes in
Which brings me back to the 2x.
It is not there to lever the account. Average exposure is 11.4% and total margin interest across the whole test was 285 dollars. Most days it does nothing at all.
It is there for the mornings when the market flushes and more signals fire than cash alone can cover. On those days it lets the test take all of them instead of turning some away, which keeps the software out of the decision and keeps the reported result closer to what the rules actually produced.
Maximum margin actually used was 1.83x. It got there on the days you would expect.
THE PALETTE
This is not a system I would hand you and tell you to trade.
There are no filters on it. Nothing checks the market environment. Nothing avoids earnings. Nothing sizes differently when volatility is high. It buys weakness in the top half of the Nasdaq 100 by range, and that is the entire thought.
That is on purpose. Filters added early tell you nothing. Layer three conditions onto a signal before you know whether the raw version works and you cannot tell what you found. Maybe there was an edge. Maybe you fit the data. There is no way back from that.
So you start wide. Establish that the underlying thing works, unprotected, across a large sample and a period the rules never saw. Then you know what you are building on.
That is what this is. A clean baseline with an obvious list of things to test next.
The other reason to leave it here is that no single system needs to be the answer. 2020 returned nothing. If this were the only thing you ran, a flat year would feel like a crisis. As one component among many it is just a piece doing what it does while something else carries the load. I wrote about how that works here.
Head down. Keep building.
Dave Johnson
Quantitative Developer
TradingTimeMachine.com
If you'd like the full historical trade list, send me a message and I'll get that over to you. Ciao'