
Bear Market RSI Entries: The Data Shows Something Most Traders Would Not Expect
Part 3: The edge concentrates. The numbers surprise.

Two articles in the finding has been consistent. We are testing one specific question across different market alignment conditions. When the 7 period RSI lands in a specific 5 point zone does it matter whether it arrived there on a declining RSI or a rising RSI.
The rising RSI entry is the conventional approach. Wait for the RSI to turn back up before buying. That confirmation signal is what most traders are taught to look for. We call it the cross over entry. The declining RSI entry is the unconventional one. The RSI is still falling when you enter. We call it the cross under entry. Both entries find the RSI landing in the same tight zone. The only difference is the direction it was traveling when it got there.
Across two alignment conditions the data has consistently challenged the conventional approach. The cross under entry has outperformed the cross over entry in the majority of zones tested. This article pushes that question into the most hostile environment in the series so far. The 20 day moving average is below the 50. The 50 is below the 200. SPY is below its 200 day moving average. Everything is pointed down.
Most traders would not consider buying weakness here. The data suggests they might want to reconsider. At least in specific zones.
Article 1 - fully bullish alignment
Article 2 - early deterioration
The Test Setup
The methodology is identical to the previous articles. Nasdaq 100 stocks over 25 years. Testing done in Wealth-Lab using WealthData, a clean daily bar data source checked for bad ticks and data oddities. Entry at the open the morning after the signal fires. Fixed 5 day hold.
The same stocks. NVDA, AMZN, TSLA and the rest of the Nasdaq 100. The same 7 period RSI tested in clean 5 point landing zones. For each zone a cross under entry triggers when the RSI crosses down through the upper boundary and closes above the lower boundary. A cross over entry triggers when the RSI crosses up through the lower boundary and closes below the upper boundary. Both entries land in the same tight 5 point zone. The only difference is the direction the RSI was traveling when it got there. Entry is at the open the morning after the signal fires. The position is held for exactly 5 trading days then closed. No stops, no profit targets, no adjustments. A fixed 5 day hold regardless of what price does in between.
The alignment tested here is the most bearish in the series. The 20 day moving average is below the 50. The 50 is below the 200. SPY is below its 200 day moving average. All three moving averages stacked in the opposite order from article 1. The broader market and the individual stock are both in a fully bearish configuration.
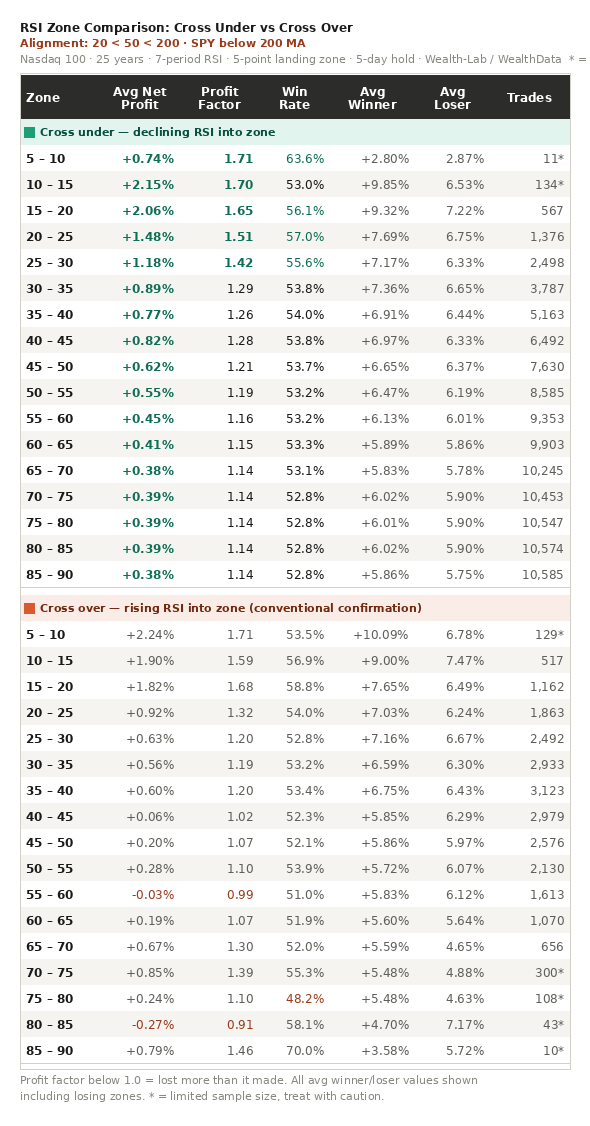
One note on sample sizes. The extreme low RSI zones have limited trade counts on both sides. The extreme high RSI zones on the cross over side are also thin. Where sample sizes are limited the findings should be treated with caution. The full data is shown.
What the Data Shows
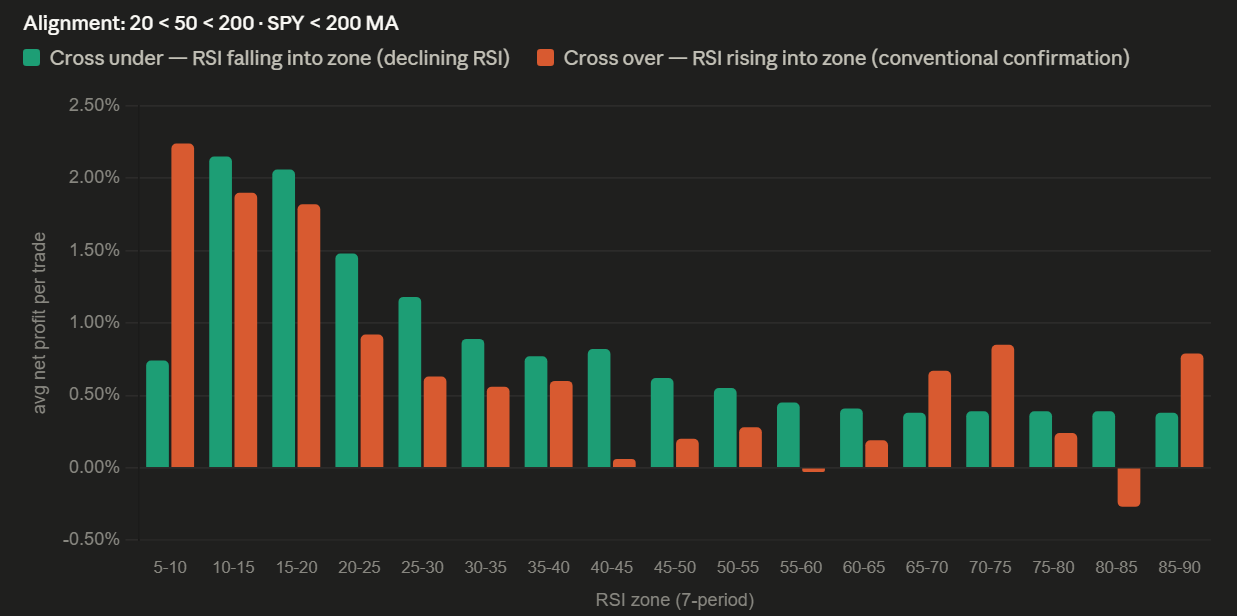
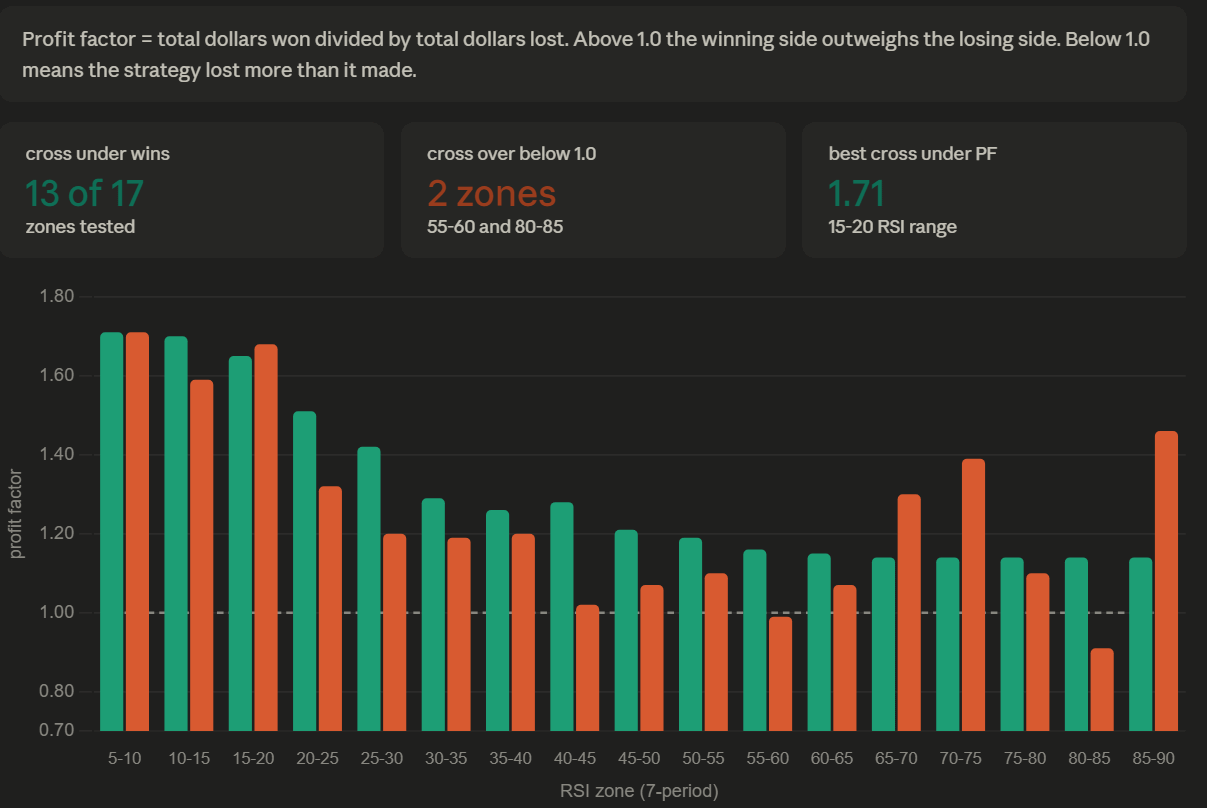
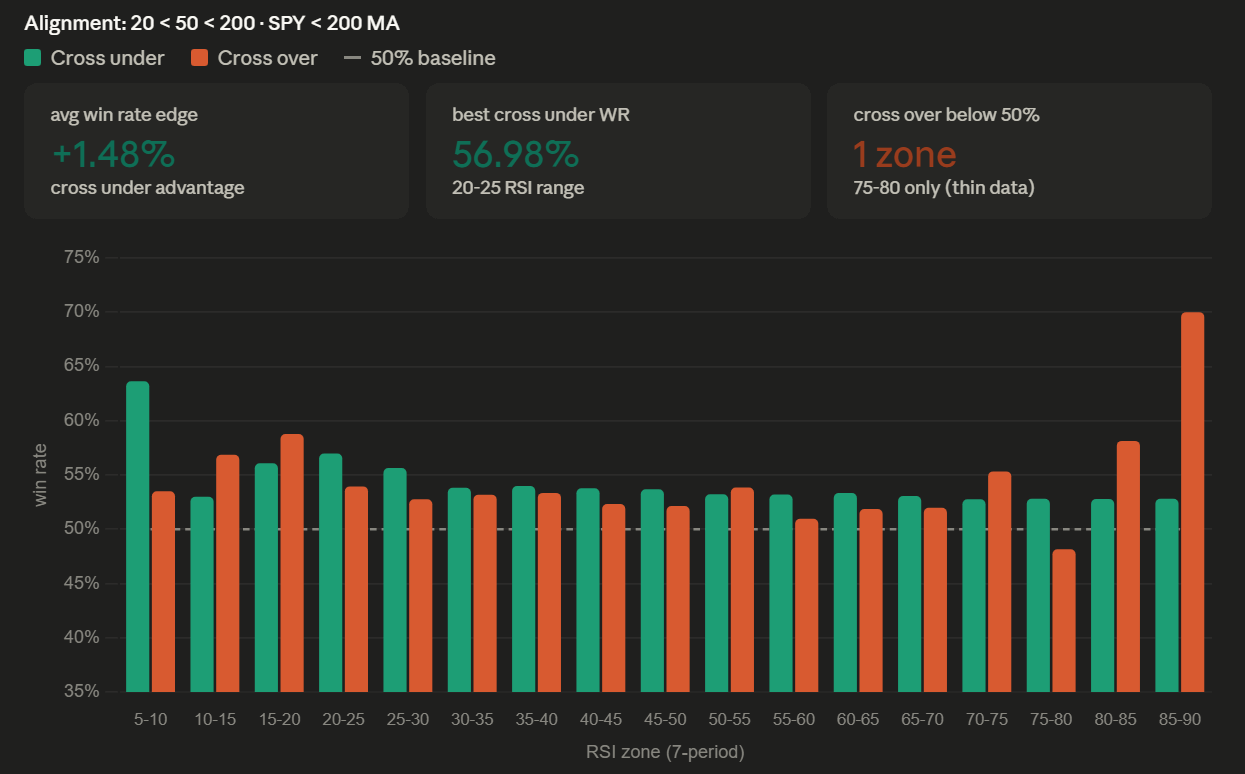
The core finding of this series continues to hold up. In 13 of 17 RSI zones, a declining RSI entering the zone (the cross under entry) outperformed a rising RSI entering the same zone. Seeing that pattern persist across three very different market environments is significant on its own.
What makes this alignment especially interesting is where the strongest results are appearing. The lower RSI zones are producing the highest quality trades we have seen in the entire series.
When the 7-period RSI falls into the 15 to 20 range on a declining basis, the cross under setup produces an average net profit of 2.06% with a profit factor of 1.65 across 567 trades. In the 20 to 25 range, the setup returns 1.48% with a 1.51 profit factor across 1,376 trades. In the 25 to 30 range, it delivers 1.18% with a 1.42 profit factor across 2,498 trades.
Those are the strongest profit factors we have seen in the lower RSI zones so far. Stronger than the fully bullish alignment. Stronger than the early deterioration alignment. In the most hostile market environment tested, the declining RSI setup in deeply oversold conditions is producing the best trade quality in the data.
There are fewer opportunities because of the alignment conditions, but the setups that do appear are consistently standing out as the highest quality trades.
The average winners and losers are also much larger here than in the fully bullish environment, roughly double in size in some zones. That is simply the nature of bearish markets. Price swings expand in both directions. But larger volatility alone does not weaken the edge. Profit factor already accounts for win rate, average winner, and average loser in a single metric. Even with the wider swings, the lower RSI zones in this bearish alignment are still producing stronger profit factors than the fully bullish environment.
From a practical standpoint, the larger swings are handled through position sizing. The underlying edge itself remains intact. If your average winner and loser are twice as large than our other setups the simple solution is to “normalize” this volatility with smaller position sizes.
What Stands Out Across Three Alignments
Three different alignment conditions have now been tested, all asking the same basic question: does a declining RSI entering a zone outperform a rising RSI entering the same zone? Across all three alignments, the answer has consistently been yes in the majority of cases. That alone is an important result.


But the most surprising finding in the series appears in this latest data set.
In the 20 to 25 and 25 to 30 RSI zones, the cross under entry actually produces a higher profit factor in the fully bearish alignment than it does in the fully bullish one. In the 20 to 25 zone, the fully bearish alignment posts a 1.51 profit factor versus 1.28 in the fully bullish alignment. In other words, the most hostile market environment tested is producing the strongest edge in those specific oversold zones.
The early deterioration alignment tells a different story. That environment, where the 20-day moving average has crossed below the 50-day while SPY itself remains relatively healthy, is where the cross under edge weakens the most in the upper RSI zones. Above the 50 to 55 RSI range, the traditional confirmation entry, the cross over, consistently outperforms the cross under. Interestingly, that pattern does not appear in either the fully bullish or fully bearish alignments.
One thing that remains remarkably consistent across all three environments is the behavior of the lower RSI zones. In deeply oversold conditions, the conventional confirmation entry has never been the superior trade. In both the fully bullish and early deterioration alignments, the cross over entry actually produces negative profit factors in the 15 to 20 and 20 to 25 RSI ranges.
There is also an important nuance in the fully bearish alignment itself. In the fully bullish environment, the gap between cross under and cross over performance in the lower zones was dramatic. Cross over often produced negative profit factors while cross under remained consistently profitable. In the fully bearish alignment, that gap narrows considerably.
In the 15 to 20 RSI zone, cross over actually edges out cross under slightly, with a 1.68 profit factor versus 1.65. In the 20 to 25 and 25 to 30 zones, cross under still performs better, but the margin is much smaller than what was seen in the bullish alignments. In other words, both approaches show edge in the lower RSI zones during fully bearish conditions. The data suggests some normalization between the two entry types, just not enough to fully erase the broader cross under advantage.
Another clear shift in the bearish alignment is the expansion in both average winner and loser size. That is expected in a high-volatility environment. What matters is that the edge, measured through profit factor, actually improves in the lower RSI zones despite the larger swings. The volatility changes the sizing requirements, not the validity of the edge itself.
Article 1 - fully bullish alignment
Article 2 - early deterioration
What This Tells Us
Three articles in. Three alignment conditions tested. The declining RSI entry has outperformed the conventional confirmation entry in the majority of zones across all three. That finding has held in the most bullish environment we tested and in the most bearish. The edge is not a product of favorable market conditions.
The lower RSI zones in the fully bearish alignment are producing the strongest profit factors in the series so far. That is not what most traders would expect. A stock with everything pointed down, generating a declining RSI into the 15 to 30 range, is showing up in the data as one of the better long side setups we have found across 25 years of Nasdaq 100 data.
One important note about what this data represents. Every qualifying trigger across the entire Nasdaq 100 universe is included. This is not filtered through portfolio slots, position limits, or capital allocation rules. Those are separate and important considerations for system design. What this data shows is the raw entry timing question across the complete population of signals. That is what gives the trade counts their statistical meaning.
This is raw research. Not a trading system. A complete system requires position sizing, stop methodology, portfolio heat management, and exit optimization. None of that is addressed here. What is addressed is a specific and testable question about entry timing across three different alignment conditions.
Some people will ask what they are supposed to do with this. The answer is straightforward. In the lower RSI zones a declining RSI is consistently better than a rising RSI across every alignment tested. Knowing where that edge lives and where it fades is worth something regardless of what you do with it next.
If you want to see what this kind of research looks like built into complete tradeable systems, that work is on the systems page at TradingTimeMachine.com
Next up: the same test with the stock fully bearish but SPY still above its 200 day moving average. A stock fully bearish against a healthy market. Does the edge survive that condition? The data will tell us. There are so many conditions that can be tested, is there one you the reader would like me test? Let me know!
Dave Johnson
Quant Developer at